|
The new subscription page has now been
posted at Subscribe. It offers the Premium Charting service and the Daily Trading Diary separately at $180 AUD each, or $270 for the combined service (as previously offered). Existing members who wish to amend their subscription to one of the new options should contact members support, with their ShopperID or Activation Key, before 27th February 2004. |
Trading Diary
February 5, 2004
USA
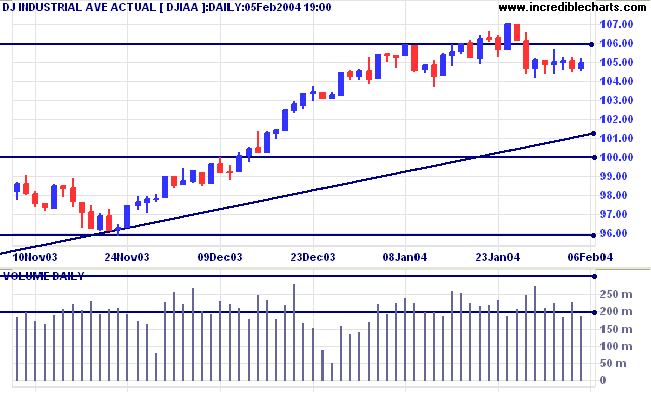
The intermediate trend is uncertain. A fall below last Thursday's low of 10417 would signal reversal to a down-trend.
The primary trend is up. A fall below support at 9600 would indicate reversal.
The intermediate trend is down.
The primary trend is up. A fall below support at 1640 would signal reversal.
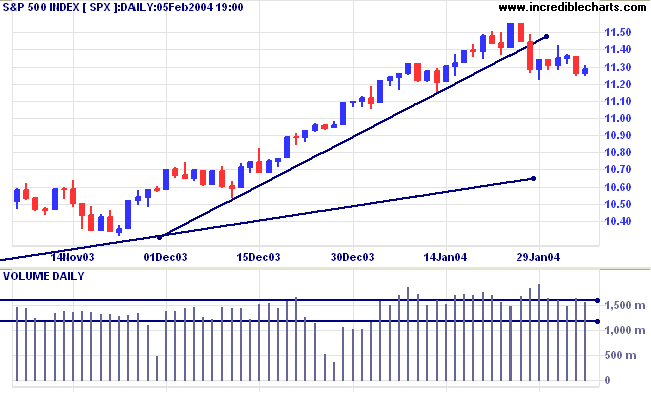
The intermediate trend is uncertain. A fall below last Thursday's low of 1122 would signal reversal to a down-trend.
Short-term: Bullish if the S&P500 is above 1155. Bearish below 1122.
Intermediate: Bullish above 1155.
Long-term: Bullish above 1000.
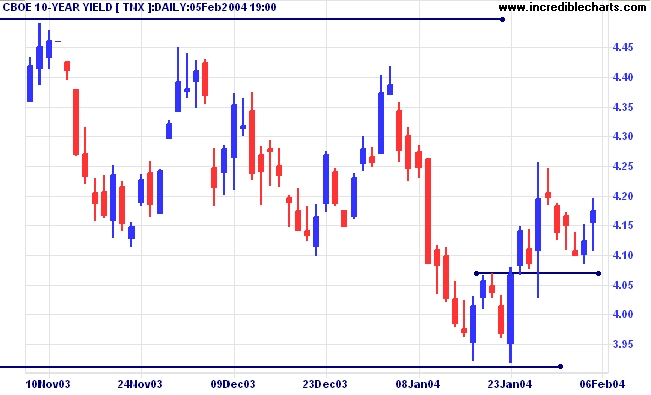
The yield on 10-year treasury notes rallied to 4.174%.
The intermediate up-trend continues.
The primary trend is up. A close below 3.93% would signal reversal.
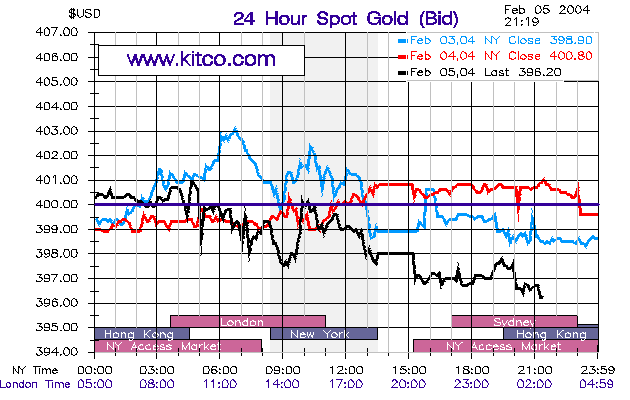
New York (21.19): Spot gold fell sharply to $396.20.
The intermediate trend is down.
The primary trend is up. A fall below $370 would signal reversal.
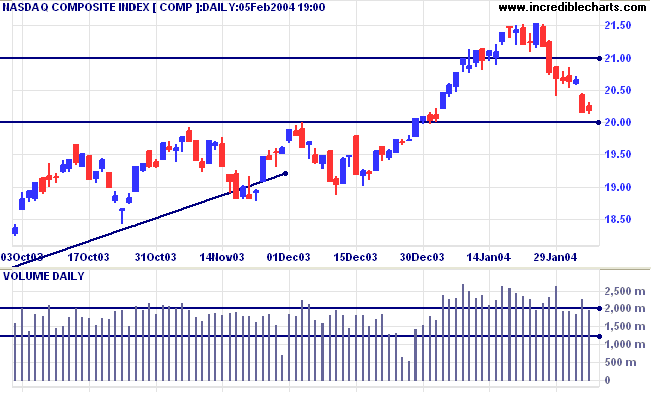
A fall below 3271 would signal an intermediate down-trend, with a likely test of support at 3160.
Short-term: Bullish above 3350. Bearish below 3271 (Thursday's low).
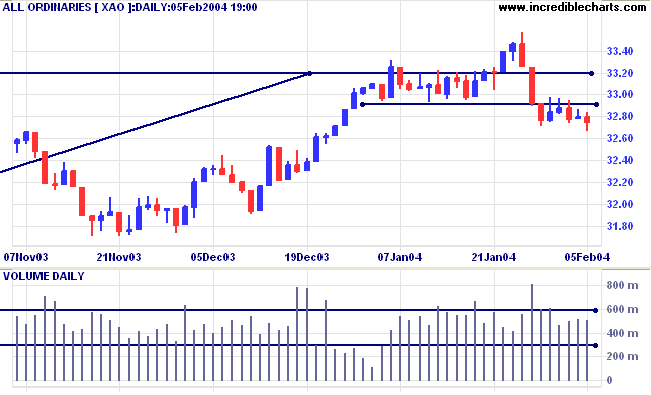
The primary trend is up. A fall below 3160 (the October 1 low) would signal reversal.
Intermediate term: Bullish above 3350. Bearish below 3160.
Long-term: Bearish below 3160.
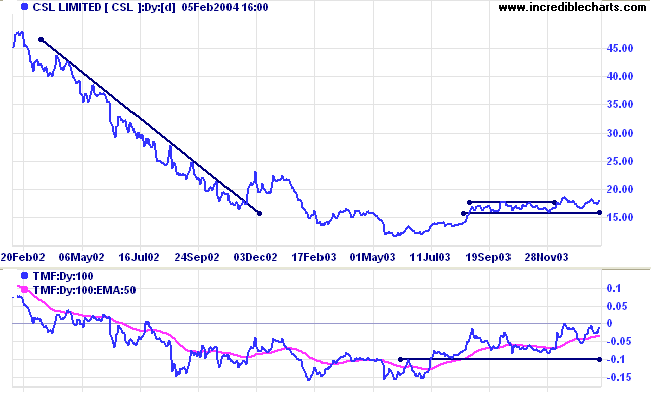
Last covered on December 8, 2003.
CSL formed a broad base over the last year, following a sharp stage 4 down-trend. Price is forming higher lows; a bullish sign.
Twiggs Money Flow displays a similar pattern, threatening to cross above zero.
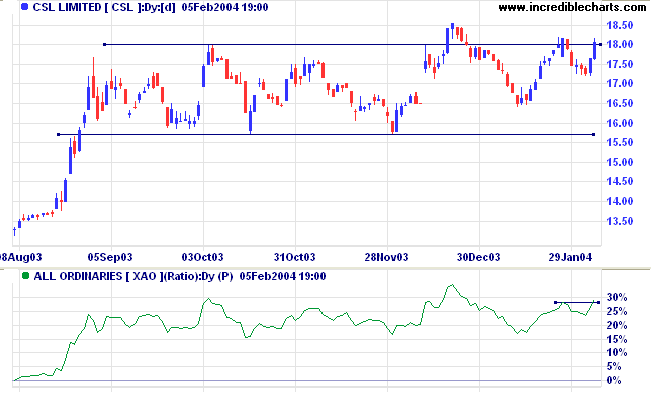
It may be prudent to wait for a pull-back that respects the new support level at 18.00; especially as volume on the latest rally is fairly thin.
A close below support at 15.70, on the other hand, would be bearish.
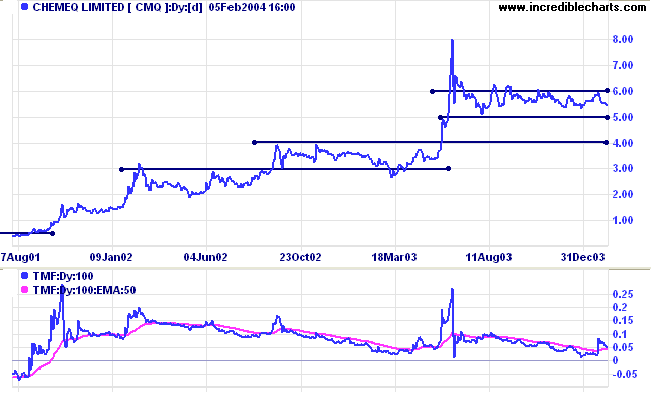
Last covered October 21, 2003.
Chemeq has consolidated between 5.00 and 6.00 since the blow-off spike in June 2003. Twiggs Money Flow has declined but is still impressive, not having fallen below zero since 2001. This stock may well have further upside and should be monitored closely.
A break above 6.00 would be bullish; below 5.00, bearish.
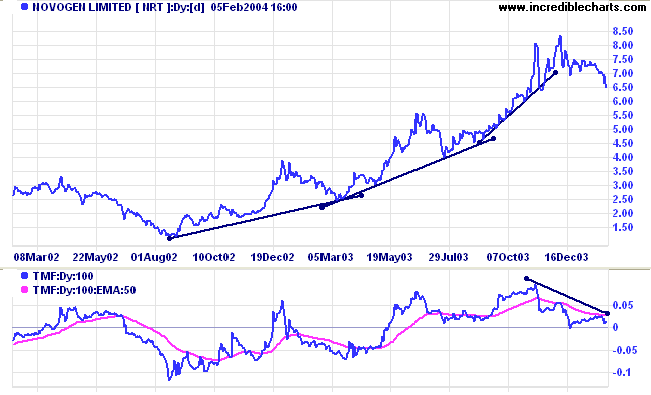
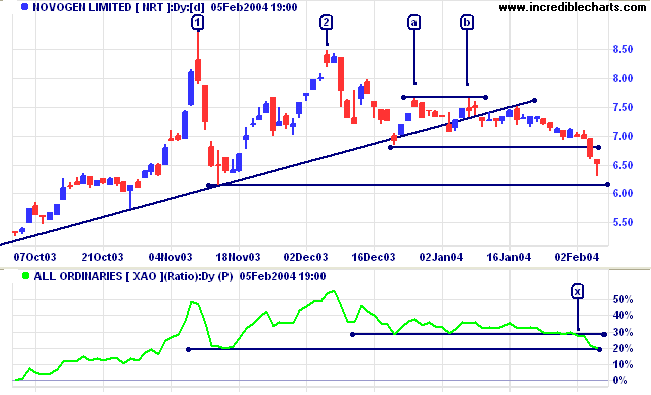
Last covered December 10, 2003. NRT has struggled to make further gains after the blow-off spike in November 2003 and is now threatening to reverse into a down-trend. Twiggs Money Flow displays a bearish divergence.
Relative Strength (price ratio: xao) has broken below the 1-month support level at [x] and is threatening the 3-month level. A peak that forms below resistance at 30% would add further confirmation of the bear signal.
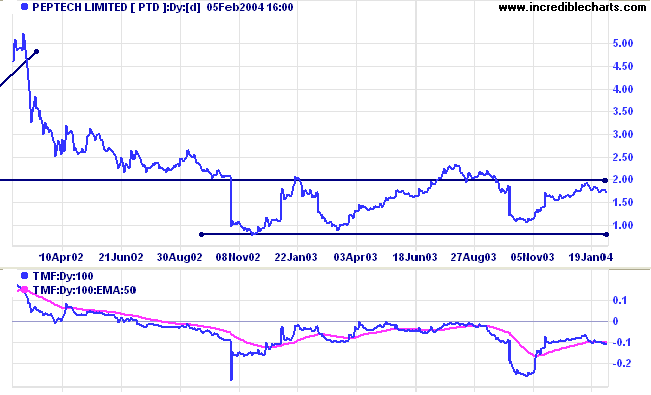
Last covered November 19, 2003.
Peptech encountered strong resistance at 2.00. Twiggs Money Flow signals distribution.
Support is at 1.00.
~ Robert Sachs.
There are major obstacles to offering a
free trial of the Trading Diary.
Instead we have enabled readers to purchase a single
issue on the
Subscribe
page.
You can now view back issues at the Daily Trading Diary Archives.
Back Issues

Author: Colin Twiggs is a former investment banker with almost 40 years of experience in financial markets. He co-founded Incredible Charts and writes the popular Trading Diary and Patient Investor newsletters.
Using a top-down approach, Colin identifies key macro trends in the global economy before evaluating selected opportunities using a combination of fundamental and technical analysis.
Focusing on interest rates and financial market liquidity as primary drivers of the economic cycle, he warned of the 2008/2009 and 2020 bear markets well ahead of actual events.
He founded PVT Capital (AFSL No. 546090) in May 2023, which offers investment strategy and advice to wholesale clients.