Incredible Charts Version 4.0.2.700
The new version with NYSE, Nasdaq and Amex charts is now available.
Please check Help >> About to confirm that your version has automatically updated.
If there are any problems with the updater,
you can download and install the latest version over your existing version.
The new version with NYSE, Nasdaq and Amex charts is now available.
Please check Help >> About to confirm that your version has automatically updated.
If there are any problems with the updater,
you can download and install the latest version over your existing version.
Trading Diary
December 8, 2003
These extracts from my daily trading diary are
for educational purposes and should not be interpreted as
investment advice. Full terms and conditions can be found at
Terms
of Use .
USA
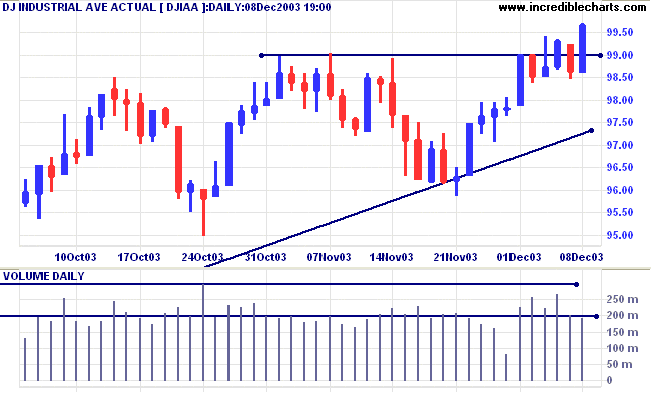
The Dow Industrial Average rallied more than 1%
to close at 9965, breaking out of the narrow consolidation over
the last 4 days. The index is likely to test resistance at 10,000
but low volume indicates that resistance will not be easily
overcome.
The intermediate trend is up.
The primary trend is up.
The intermediate trend is up.
The primary trend is up.
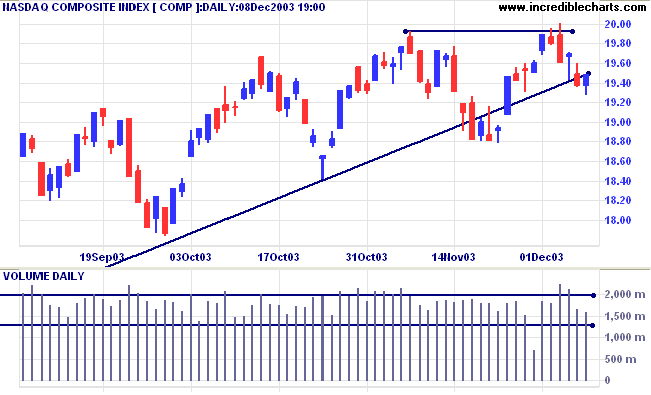
The Nasdaq Composite reversed direction, closing
up 11 points at 1948. We are likely to see another test of
resistance at 2000, but lower volume signals a lack of real
commitment.
The intermediate trend is uncertain.
The primary trend is up. A fall below support at 1640 will signal reversal.
The intermediate trend is uncertain.
The primary trend is up. A fall below support at 1640 will signal reversal.
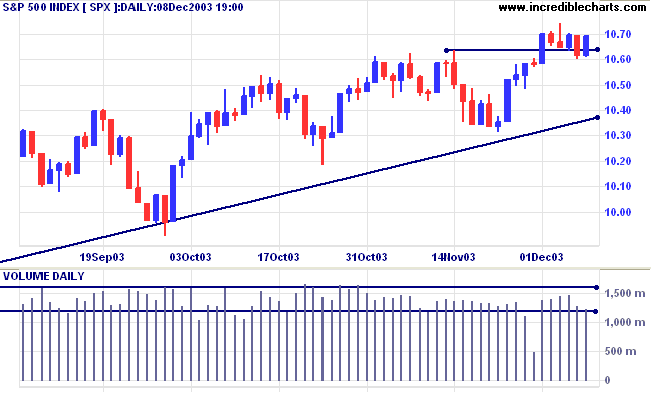
The S&P 500 closed 8 points higher at 1069,
still within the consolidation of the past week.
The intermediate trend is uncertain.
Short-term: Bullish if the S&P500 breaks above resistance at 1070. Bearish below support at 1060.
The intermediate trend is uncertain.
Short-term: Bullish if the S&P500 breaks above resistance at 1070. Bearish below support at 1060.
The primary trend is up. A fall below 960 will
signal reversal.
Intermediate: Bullish above 1070.
Long-term: Bullish above 960.
Intermediate: Bullish above 1070.
Long-term: Bullish above 960.
The Chartcraft NYSE Bullish % Indicator recovered
to 81.84% (December 8).
Dollar low
The dollar sank to a record low of $1.22 to the euro. (more)
The dollar sank to a record low of $1.22 to the euro. (more)
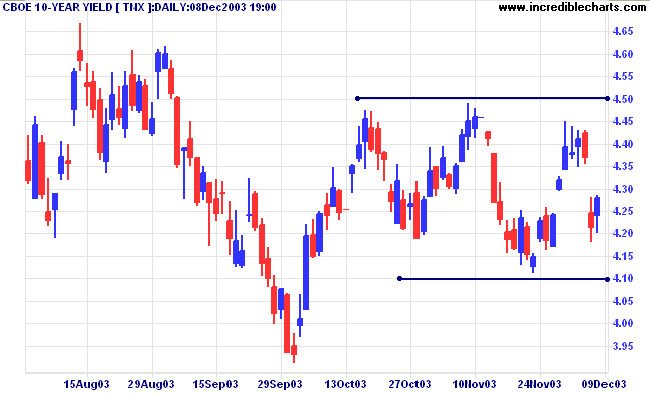
Treasury yields
The yield on 10-year treasury notes is ranging between 4.1% and 4.5%, closing up at 4.27%.
The intermediate trend is down.
The primary trend is up.
The yield on 10-year treasury notes is ranging between 4.1% and 4.5%, closing up at 4.27%.
The intermediate trend is down.
The primary trend is up.
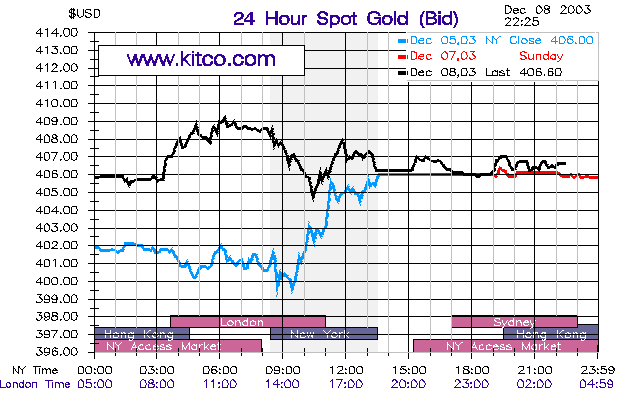
Gold
New York (22.25): Spot gold is level at $406.60.
The intermediate trend is up.
The primary trend is up. Expect support at 400, resistance at 415.
New York (22.25): Spot gold is level at $406.60.
The intermediate trend is up.
The primary trend is up. Expect support at 400, resistance at 415.
ASX Australia
Late selling forced a weak close on the All
Ordinaries, down 6 points at 3226 on higher volume.
The intermediate up-trend continues.
The intermediate up-trend continues.
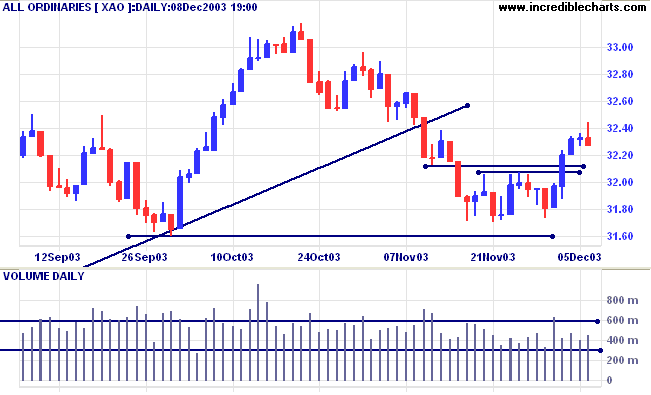
MACD (26,12,9) and Slow Stochastic (20,3,3) are
above their signal lines.
Short-term: Bullish above 3236, Friday's high. Bearish below 3173 (Monday's low).
Short-term: Bullish above 3236, Friday's high. Bearish below 3173 (Monday's low).
XAO is below the long-term trendline, signaling
weakness. The primary trend is up but will reverse if there is a
fall below 3160 (the October 1 low). Twiggs Money Flow (100)
signals accumulation, but following a large bearish triple
divergence.
Intermediate term: Bullish above 3173. Bearish below 3160.
Long-term: Bearish below 3160.
Intermediate term: Bullish above 3173. Bearish below 3160.
Long-term: Bearish below 3160.
Alinta [ALN]
Last covered on September 4, 2003.
Alinta has left a gap at [b], between the latest peak and the previous trough [a], after breaking below its long-term trendline. Bill McLaren identifies this as a signal for a fast down-trend.
Last covered on September 4, 2003.
Alinta has left a gap at [b], between the latest peak and the previous trough [a], after breaking below its long-term trendline. Bill McLaren identifies this as a signal for a fast down-trend.
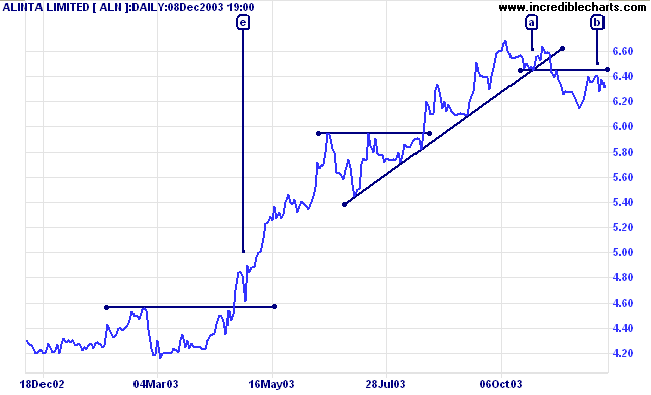
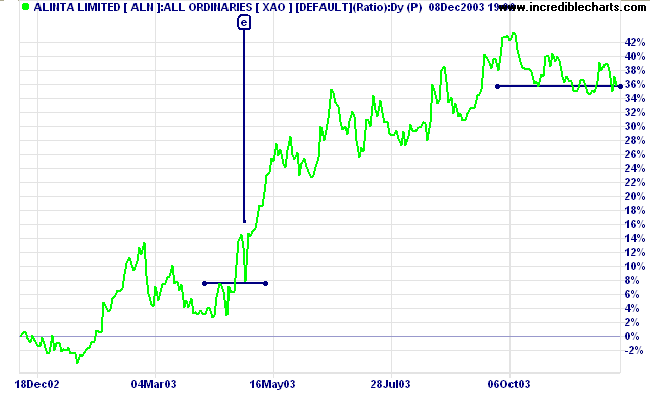
Relative Strength (xao) is declining. Look for a
peak that fails to break above the new resistance level; in a
similar fashion to the earlier long entry signal at [e], where
both price and RS respect the new support level.
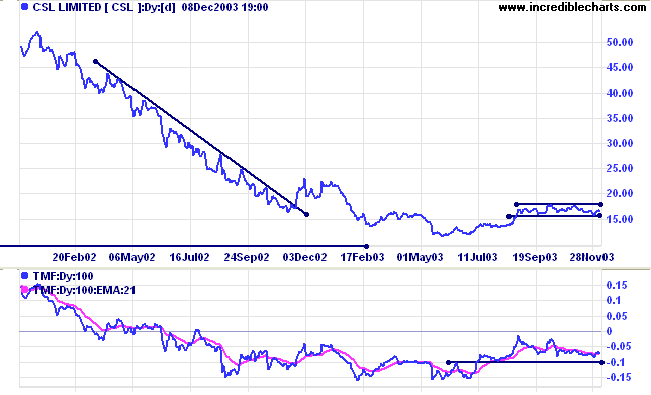
CSL Limited [CSL]
Last covered on October 7, 2003.
CSL is forming a broad base after a strong down-trend. Twiggs Money Flow (100) has crept upwards since June.
The narrow range at the resistance level is bullish.
Last covered on October 7, 2003.
CSL is forming a broad base after a strong down-trend. Twiggs Money Flow (100) has crept upwards since June.
The narrow range at the resistance level is bullish.
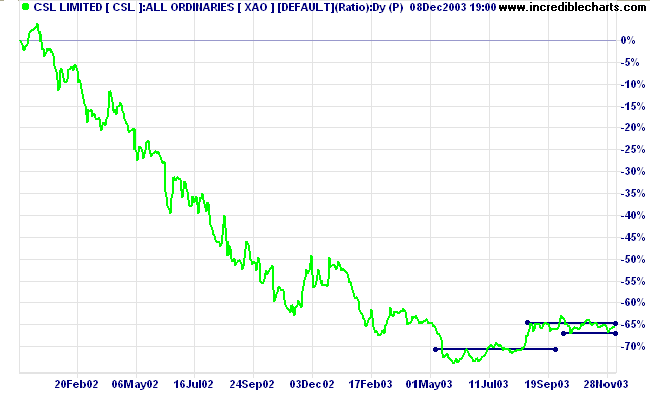
Relative Strength (xao) shows a similar
consolidation pattern. An upward breakout will be a strong bull
signal; a downward breakout ..... bearish. Especially if price
and RS imitate each other.
Understanding
the Trading Diary has been expanded to offer further
assistance to readers, including directions on how to search the
archives.
Colin Twiggs
Avoid loud and aggressive persons,
they are vexations to the spirit.
~ Max Ehrmann: Desiderata (1927)
they are vexations to the spirit.
~ Max Ehrmann: Desiderata (1927)
Stock
Screens: USA
US stocks and US indexes are still being added to the stock screen module
and should be available by next week.
US stocks and US indexes are still being added to the stock screen module
and should be available by next week.
Back Issues
You can now view back issues at the Daily Trading Diary Archives.
You can now view back issues at the Daily Trading Diary Archives.
Back Issues
Access the Trading Diary Archives.

Author: Colin Twiggs is a former investment banker with almost 40 years of experience in financial markets. He co-founded Incredible Charts and writes the popular Trading Diary and Patient Investor newsletters.
Using a top-down approach, Colin identifies key macro trends in the global economy before evaluating selected opportunities using a combination of fundamental and technical analysis.
Focusing on interest rates and financial market liquidity as primary drivers of the economic cycle, he warned of the 2008/2009 and 2020 bear markets well ahead of actual events.
He founded PVT Capital (AFSL No. 546090) in May 2023, which offers investment strategy and advice to wholesale clients.