|
Trading Plans Here is an excerpt from a Chart Forum post I made that bears repeating: Rule #1 for me is that the trading plan should be concise enough to carry in your head, without referring back to the written version........... The Trading plan is a summary of what, when, how and how much: stock selection, entries, exits, and risk management. I believe that there is an inverse relationship: the more you put in, the less you get out. Colin . |
Trading Diary
September 4, 2003
The intermediate trend is up.
The primary trend is up.
Twiggs Money Flow and MACD are both bullish.
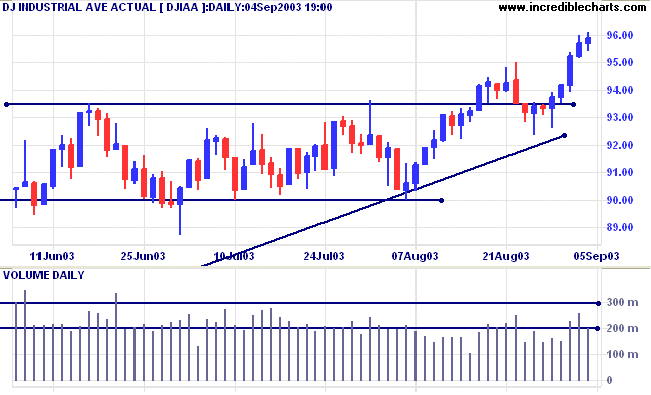
The intermediate trend is up.
The primary trend is up.
Twiggs Money Flow and MACD are both bullish.
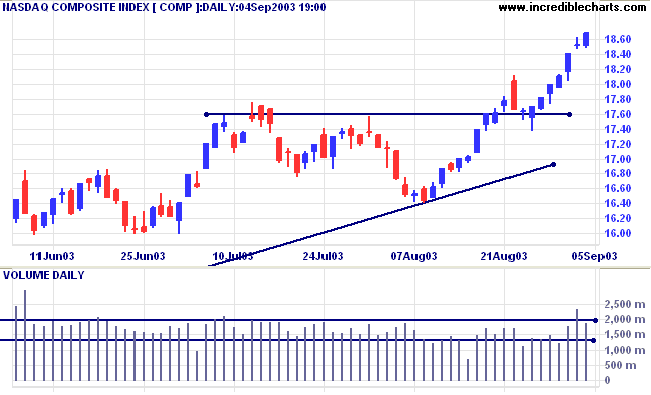
The intermediate trend is up.
The primary trend is up.
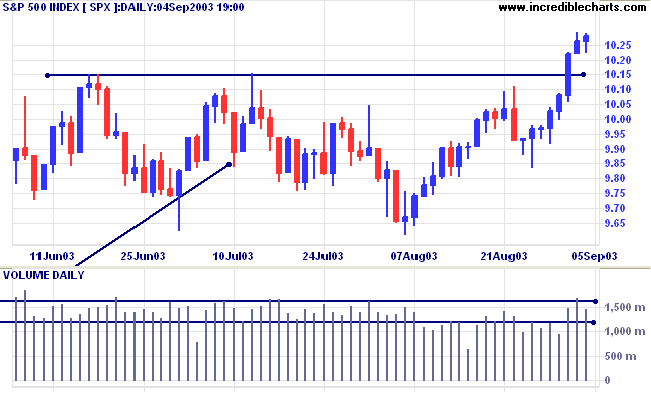
Short-term: Long above 1022.
Intermediate: Long if the index is above 1015.
Long-term: Long if the index is above 960.
Federal reserve governor Ben Bernanke says that the economy still has a lot of slack and the Fed will keep rates low through much of 2004 and may even make further cuts. (more)
After the Fed Governor's announcement, the 10-year treasury note yield eased slightly to 4.51%.
The intermediate trend is up, with the yield forming a bullish consolidation above support at 4.25%.
The primary trend is up.
New York (19.51): Spot gold is at $373.30 after testing 370.
The primary trend is up.
Price has broken above a symmetrical triangle, with a target of 420. There is still some resistance at 382.
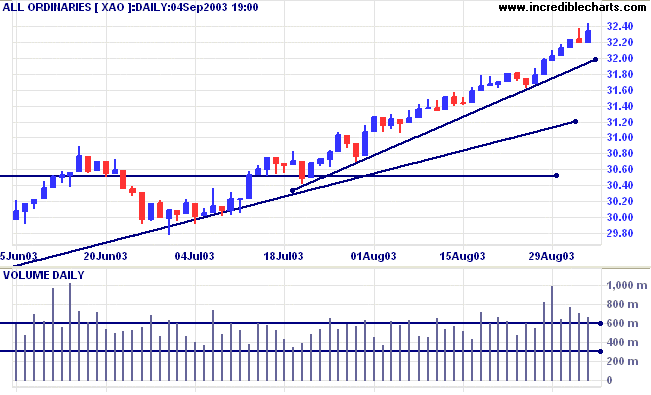
MACD (26,12,9) is above its signal line; Slow Stochastic (20,3,3) is below;
Twiggs Money Flow signals accumulation.
Short-term: Long if the XAO is above 3219.
Intermediate: Long if the index is above 3162.
Long-term: Long if the index is above 2978 .
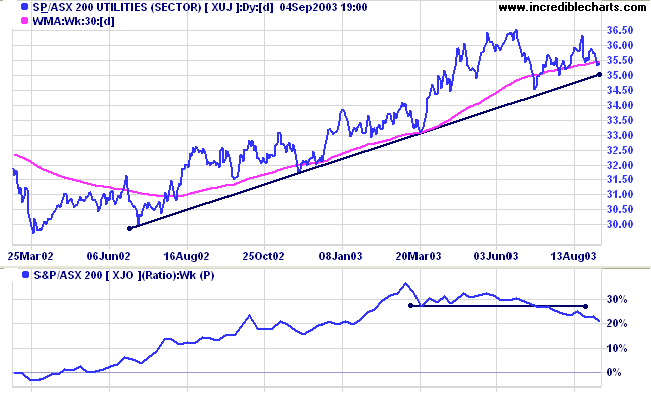
The Utilities index [XUJ] is in a stage 2 up-trend, but Relative Strength has fallen to a 6-month low.
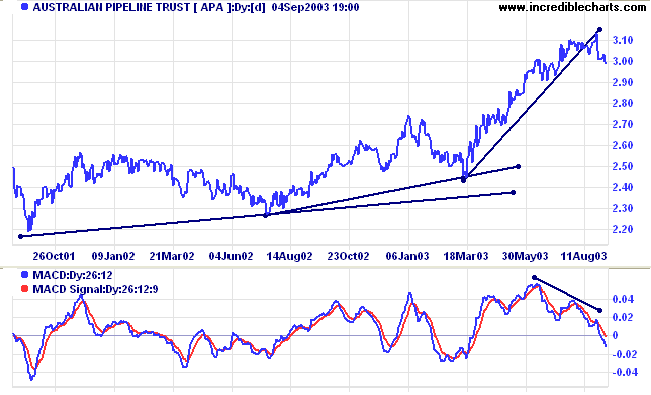
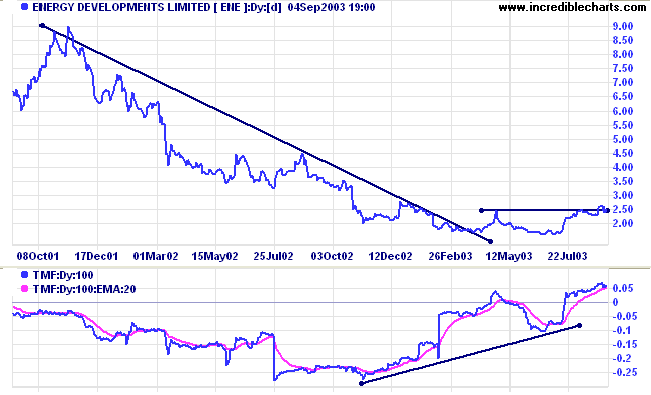
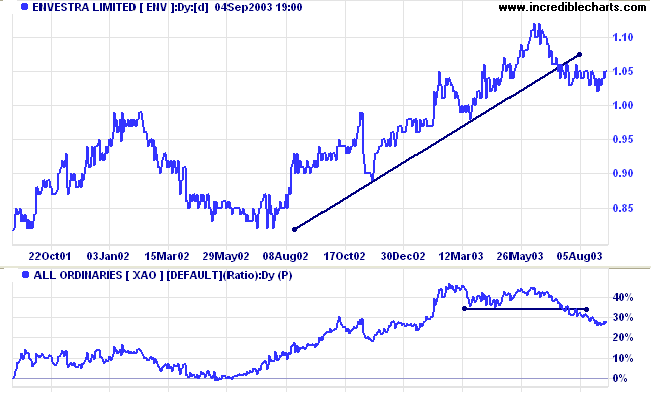
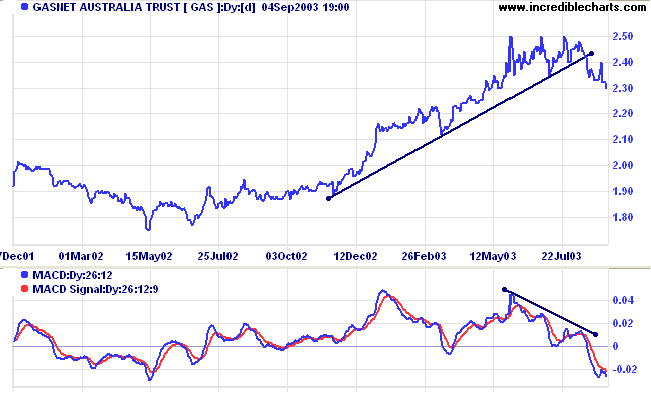
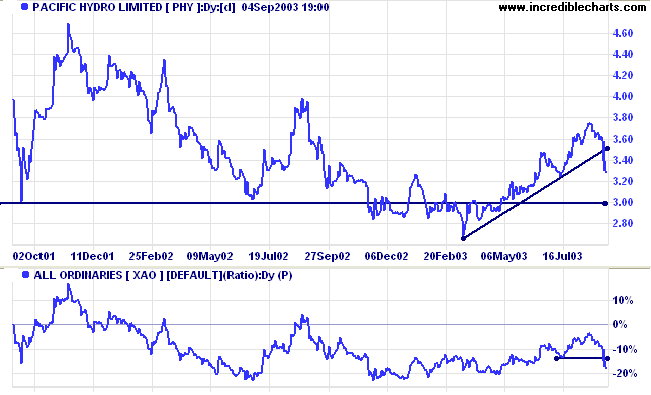
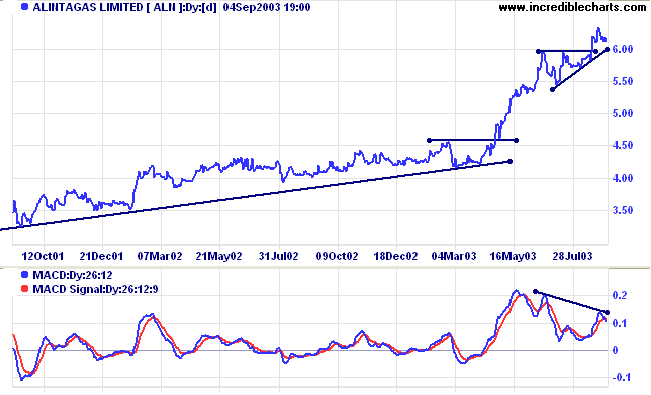
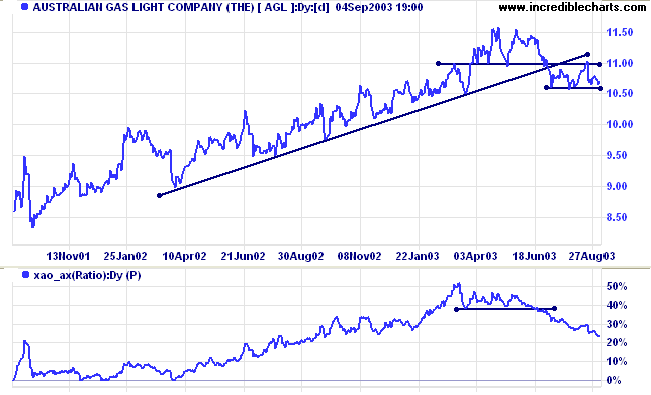
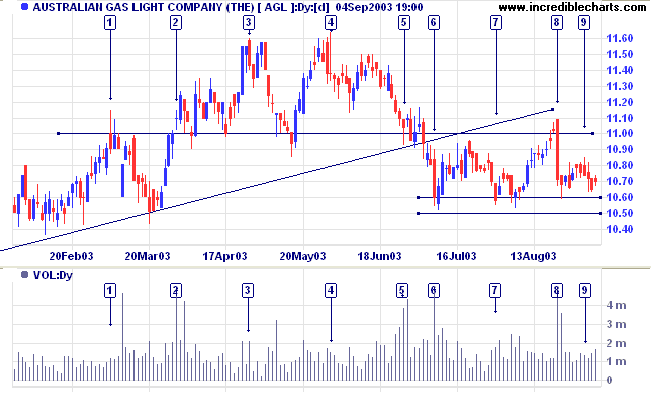
The stock is now at a key point: support has formed at 10.60/10.50 with equal lows at [6] and [7] but strong resistance has formed at 11.00, with a false break at [8] followed by a sharp pull-back on heavy volume. We now see consolidation at [9], near to the support level, a bear signal.
A fall below 10.50 (or close below 10.60) would be a strong bear signal, while a break above 11.00 would be bullish.
while sweeping on to the grand fallacy.
~ Unknown
| Use the File >> Export Files command to regularly copy your watchlist (.viz) and project (.ini) files to a removable disk. See Backup for further details. |
You can now view back issues at the Daily Trading Diary Archives.
Back Issues

Author: Colin Twiggs is a former investment banker with almost 40 years of experience in financial markets. He co-founded Incredible Charts and writes the popular Trading Diary and Patient Investor newsletters.
Using a top-down approach, Colin identifies key macro trends in the global economy before evaluating selected opportunities using a combination of fundamental and technical analysis.
Focusing on interest rates and financial market liquidity as primary drivers of the economic cycle, he warned of the 2008/2009 and 2020 bear markets well ahead of actual events.
He founded PVT Capital (AFSL No. 546090) in May 2023, which offers investment strategy and advice to wholesale clients.
