|
Incredible Charts version
4.0.2.600 See What's New for details. Check Help >> About to ensure that you have received the automatic update. |
Trading Diary
October 21, 2003
These extracts from my daily trading diary
are for educational purposes
and should not be interpreted as investment
advice. Full terms and conditions can be found at Terms
of Use .
USA
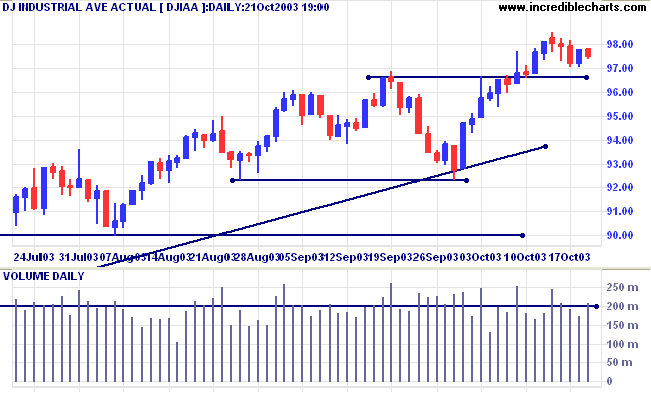
The Dow Industrial Average closed weaker at 9748 on higher
volume, signaling that another test of support is likely.
The intermediate trend is up. An up-turn above 9660 will signal trend strength.
The primary trend is up. A fall below 9000 will signal reversal.
The intermediate trend is up. An up-turn above 9660 will signal trend strength.
The primary trend is up. A fall below 9000 will signal reversal.
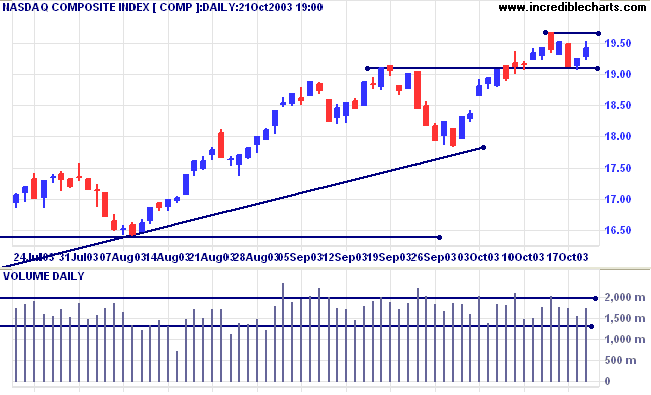
The Nasdaq Composite rallied 16 points to close at 1941 on higher
volume. Expect some resistance at 1967.
The intermediate trend is up.
The primary trend is up. A fall below 1640 will signal reversal.
The intermediate trend is up.
The primary trend is up. A fall below 1640 will signal reversal.
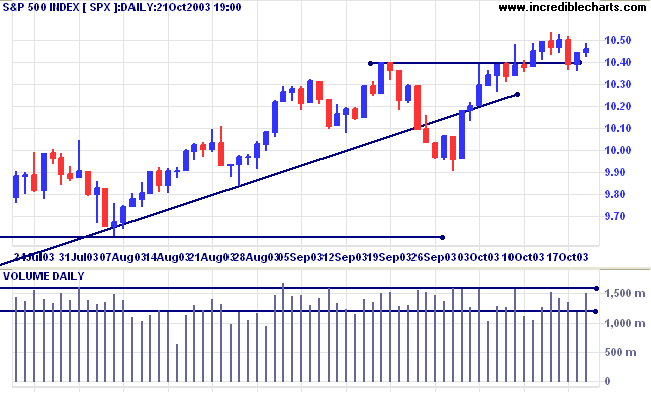
The S&P 500 gained 1 point to close at 1046 on higher
volume.
The intermediate trend is up.
The primary trend is up. A fall below 960 will signal reversal.
The intermediate trend is up.
The primary trend is up. A fall below 960 will signal reversal.
The Chartcraft NYSE Bullish % Indicator recovered
slightly to 81.65% ( October 21).
Market Strategy
Short-term: Bullish if the S&P500 is above 1045.
Intermediate: Bullish above 1045.
Long-term: Bullish above 960.
Short-term: Bullish if the S&P500 is above 1045.
Intermediate: Bullish above 1045.
Long-term: Bullish above 960.
Dollar down, bonds up
The dollar weakened against the euro and the yen. (more)
The dollar weakened against the euro and the yen. (more)
Treasury yields
The yield on 10-year treasury notes eased slightly to 4.37%.
The intermediate trend is up. Expect resistance at 4.60%.
The primary trend is up.
The yield on 10-year treasury notes eased slightly to 4.37%.
The intermediate trend is up. Expect resistance at 4.60%.
The primary trend is up.
Gold
New York (21:48): Spot gold rallied strongly to $380.10.
The intermediate trend is uncertain.
The primary trend is up, with support at 343 to 350.
New York (21:48): Spot gold rallied strongly to $380.10.
The intermediate trend is uncertain.
The primary trend is up, with support at 343 to 350.
ASX Australia
The All Ordinaries broke out above its congestion pattern,
closing up 16 points at 3311 on higher volume.
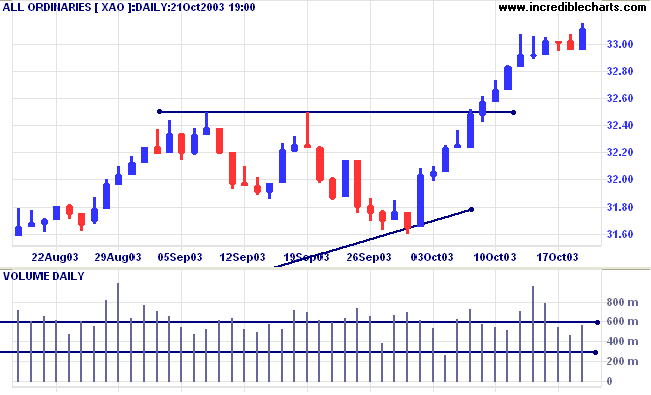
The intermediate trend is up.
The primary trend is up. A fall below 3160 will signal reversal.
MACD (26,12,9) is above its signal line; Slow Stochastic (20,3,3) is above; Twiggs Money Flow (100) has crossed back above its signal line but still displays a bearish "triple" divergence.
The primary trend is up. A fall below 3160 will signal reversal.
MACD (26,12,9) is above its signal line; Slow Stochastic (20,3,3) is above; Twiggs Money Flow (100) has crossed back above its signal line but still displays a bearish "triple" divergence.
Market Strategy
Short-term: Bullish if the All Ords is above 3307.
Intermediate: Bullish above 3307.
Long-term: Bullish above 3160.
Short-term: Bullish if the All Ords is above 3307.
Intermediate: Bullish above 3307.
Long-term: Bullish above 3160.
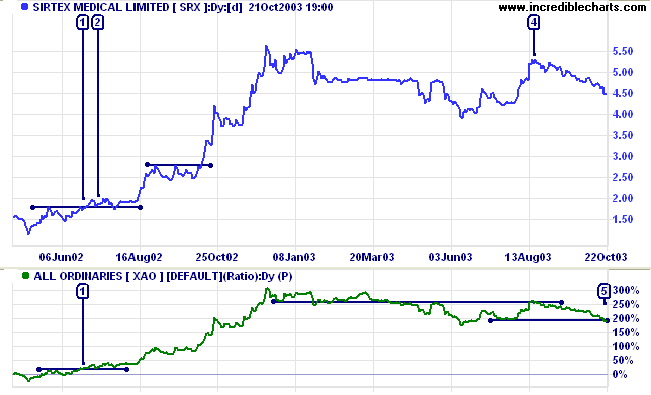
Sirtex [SRX]
This biotech stock has formed a broad stage 3 top. Relative Strength (price ratio: xao) has declined, with a lower high at [4]. The indicator has now given another bear signal at [5], with a break below its previous low.
In the earlier up-trend, two high probability entry points are evident: Price made a short pull-back below resistance at [1] while RS had already given a bull signal, rising above its previous high and respecting the support level on the pull-back. At [2], price respected the new support level accompanied by a similar pattern on RS.
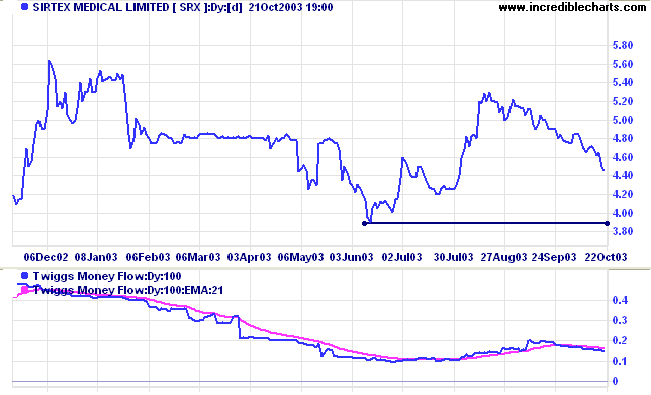
Twiggs Money Flow (100) is falling but still signals
accumulation.
Support is at 3.80/3.90; a fall below this level will be strong confirmation of the RS bear signal. A rise above resistance at 5.30 would be bullish.
Support is at 3.80/3.90; a fall below this level will be strong confirmation of the RS bear signal. A rise above resistance at 5.30 would be bullish.
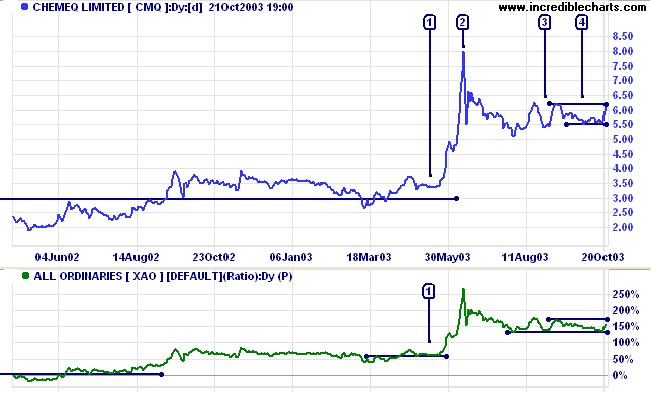
Chemeq [CMQ]
Last covered June 25, 2003.
CMQ retreated after a blow-off spike at [2], before consolidating above 5.00. The pattern is bullish, with higher lows at [3] and [4]. Relative Strength (price ratio: xao) has held above support and is now rising to test the last high.
Last covered June 25, 2003.
CMQ retreated after a blow-off spike at [2], before consolidating above 5.00. The pattern is bullish, with higher lows at [3] and [4]. Relative Strength (price ratio: xao) has held above support and is now rising to test the last high.
Twiggs Money Flow (100) signals strong accumulation over the past
2 years.
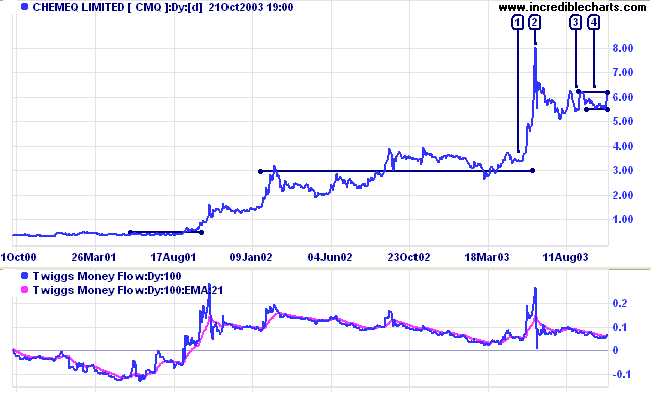
A rise of price and RS above their September highs will be a bull
signal; strengthened if the next pull-back respects the new
level.
A close below 5.50 will be bearish.
A close below 5.50 will be bearish.
Understanding
the Trading Diary has been expanded to offer further
assistance to readers, including
directions on how to search the archives.
Colin Twiggs
There is a philosophy about the secondary
reaction in a bull market which should not be
overlooked.....
such secondary reactions are started by developments which could by no possibility have been foreseen.
These have their obvious effect upon an over-extended bull account.
The market therefore performs its most valuable service, that of insurance.
It recedes to a safer level until it is entirely clear as to the nature of the unfavorable symptom
which it cannot yet diagnose with certainty.
~ William Hamilton: The Wall Street Journal (November 3, 1922)
Troubleshooting
At the top of the Help menu is the Troubleshooting page.
This provides an index of the problems most frequently encountered by members,
including firewalls, operating systems, Internet connections and activation keys.
At the top of the Help menu is the Troubleshooting page.
This provides an index of the problems most frequently encountered by members,
including firewalls, operating systems, Internet connections and activation keys.
Back Issues
You can now view back issues at the Daily Trading Diary Archives.
You can now view back issues at the Daily Trading Diary Archives.
Back Issues
Access the Trading Diary Archives.

Author: Colin Twiggs is a former investment banker with almost 40 years of experience in financial markets. He co-founded Incredible Charts and writes the popular Trading Diary and Patient Investor newsletters.
Using a top-down approach, Colin identifies key macro trends in the global economy before evaluating selected opportunities using a combination of fundamental and technical analysis.
Focusing on interest rates and financial market liquidity as primary drivers of the economic cycle, he warned of the 2008/2009 and 2020 bear markets well ahead of actual events.
He founded PVT Capital (AFSL No. 546090) in May 2023, which offers investment strategy and advice to wholesale clients.