
Trading Diary
November 19, 2003
These extracts from my daily trading diary are
for educational purposes and should not be interpreted as
investment advice. Full terms and conditions can be found at
Terms
of Use .
USA
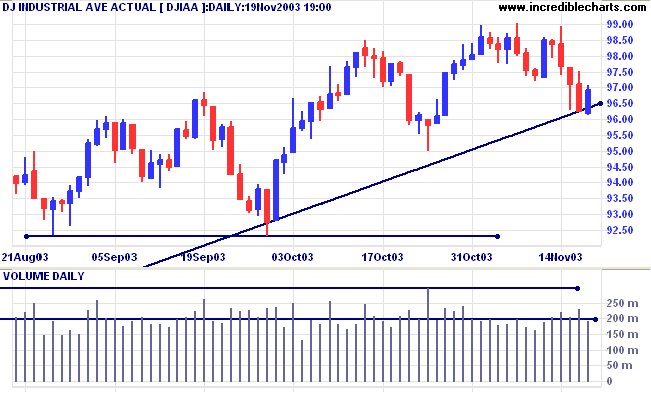
The Dow Industrial Average rallied to 9690 after testing the
primary trendline. Low volume signals a lack of enthusiasm from
buyers.
The intermediate trend is down.
The primary trend is up. A fall below 9000 will signal reversal.
The intermediate trend is down.
The primary trend is up. A fall below 9000 will signal reversal.
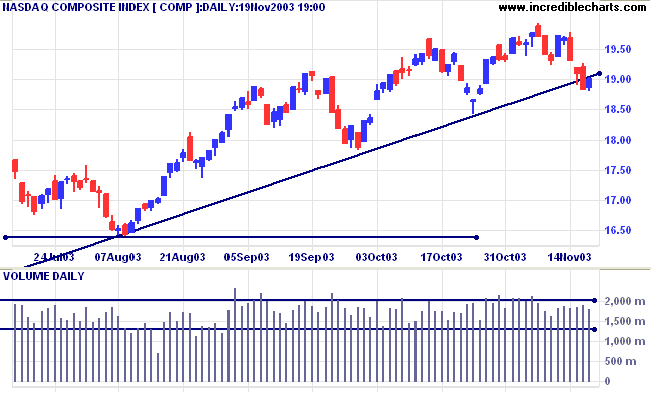
The Nasdaq Composite recovered to close at 1900 on average volume
but remains below the primary trendline.
The intermediate trend is down. Expect support at 1840 and 1780, the previous two lows.
The primary trend is up. A fall below 1640 will signal reversal.
The intermediate trend is down. Expect support at 1840 and 1780, the previous two lows.
The primary trend is up. A fall below 1640 will signal reversal.
The S&P 500 closed 8 points up at 1042 on lower
volume.
The intermediate trend is down. Expect support at the primary trendline.
Short-term: Bullish if the S&P500 is above 1062, the high of the November 7th. Bearish below 1034 (Wednesday's low).
The intermediate trend is down. Expect support at the primary trendline.
Short-term: Bullish if the S&P500 is above 1062, the high of the November 7th. Bearish below 1034 (Wednesday's low).
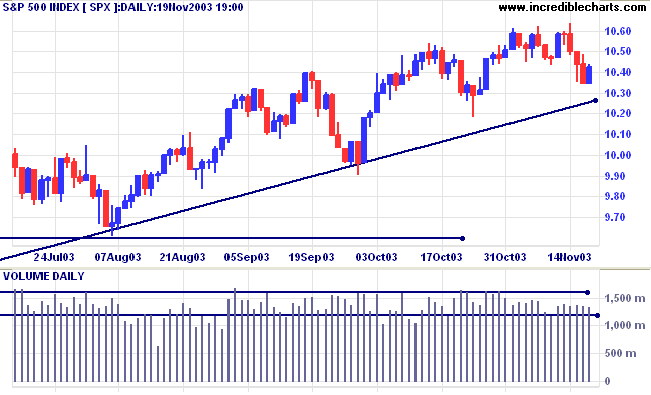
The primary trend is up. A fall below 960 will signal
reversal.
Twiggs Money Flow (100) signals distribution.
Intermediate: Bullish above 1062.
Long-term: Bullish above 960.
Twiggs Money Flow (100) signals distribution.
Intermediate: Bullish above 1062.
Long-term: Bullish above 960.
The Chartcraft NYSE Bullish % Indicator eased to
80.29% (November 19).
Hewlett-Packard
HP reports sales up 10% and earnings, before one-off charges, up 50% (at 36 cents a share) compared to the same quarter last year. (more)
HP reports sales up 10% and earnings, before one-off charges, up 50% (at 36 cents a share) compared to the same quarter last year. (more)
Forex trading scam
The FBI arrest and charge 47 traders in connection with a multi-million dollar currency trading fraud. (more)
The FBI arrest and charge 47 traders in connection with a multi-million dollar currency trading fraud. (more)
Treasury yields
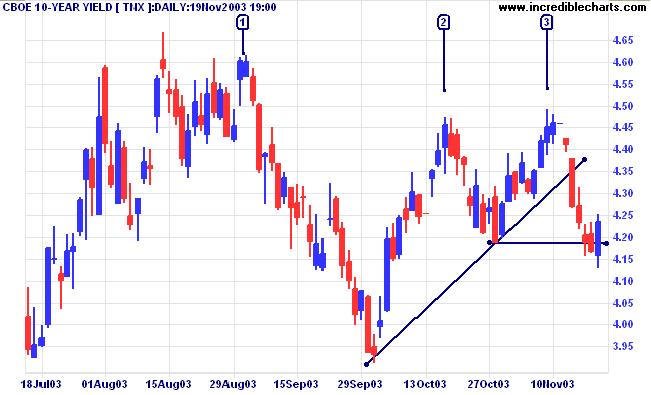
Completing what may turn out to be a false (or marginal) break, the yield on 10-year treasury notes reversed up, to 4.24%.
The intermediate trend is down.
The primary trend is up.
Completing what may turn out to be a false (or marginal) break, the yield on 10-year treasury notes reversed up, to 4.24%.
The intermediate trend is down.
The primary trend is up.
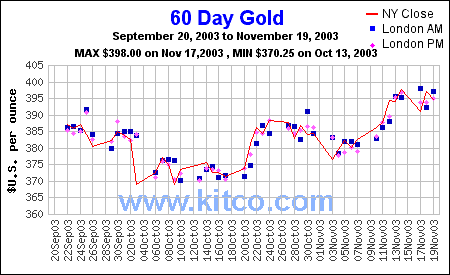
Gold
New York (18:26): Spot gold retreated to $395.30.
The intermediate trend is up.
The primary trend is up. Expect resistance at 400 to 415.
New York (18:26): Spot gold retreated to $395.30.
The intermediate trend is up.
The primary trend is up. Expect resistance at 400 to 415.
ASX Australia
The All Ordinaries closed 4 points higher at 3189. Long tails and
higher volumes over the last 2 days signal buying support.
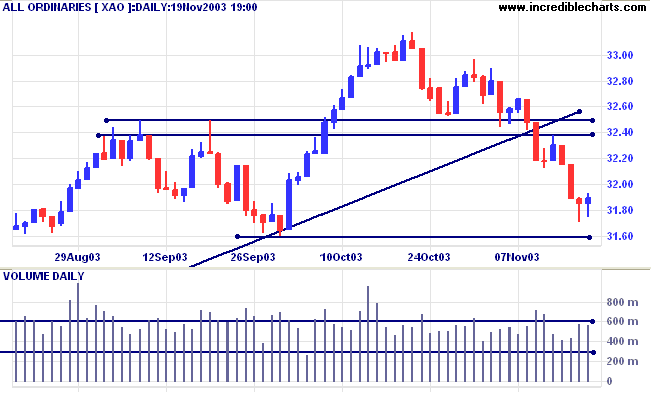
The intermediate trend is down.
MACD (26,12,9) is below its signal line; Slow Stochastic (20,3,3) has whipsawed above its signal line.
Short-term: Bullish if the All Ords crosses back above resistance at 3250. Bearish below Wednesday's low of 3175.
MACD (26,12,9) is below its signal line; Slow Stochastic (20,3,3) has whipsawed above its signal line.
Short-term: Bullish if the All Ords crosses back above resistance at 3250. Bearish below Wednesday's low of 3175.
The primary trend is up, but will reverse if there is a fall
below 3160 (the October 1 low). The index is below its supporting
trendline, signaling weakness. Twiggs Money Flow (100) signals
strong distribution, after a bearish triple
divergence.
Intermediate term: Bullish above 3250. Bearish below 3160.
Long-term: Bearish below 3160.
Intermediate term: Bullish above 3250. Bearish below 3160.
Long-term: Bearish below 3160.
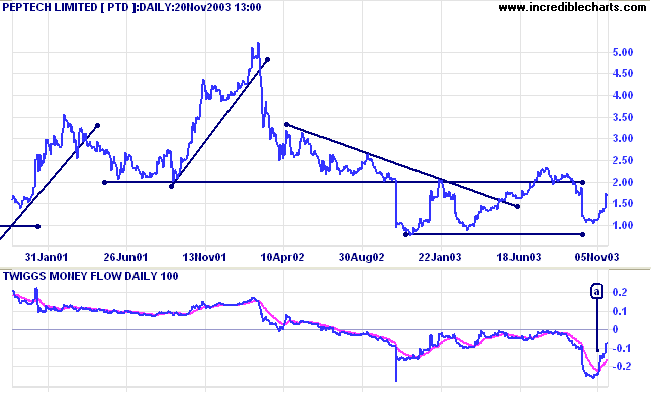
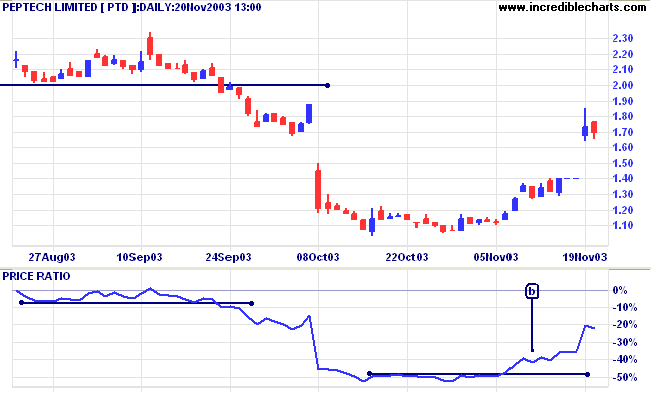
Peptech [PTD]
Last covered on October 8, 2003.
Peptech announced that it has resolved its dispute with Abbott Laboratories, where Abbott was withholding royalty payments on the arthritis drug Humira. (more)
PTD has formed a triple bottom over the last year with Twiggs Money Flow (100) signaling strong distribution.
Seven days prior to the trading halt on November 17th, the stock
started to rise, with Twiggs Money Flow jumping sharply at [a].
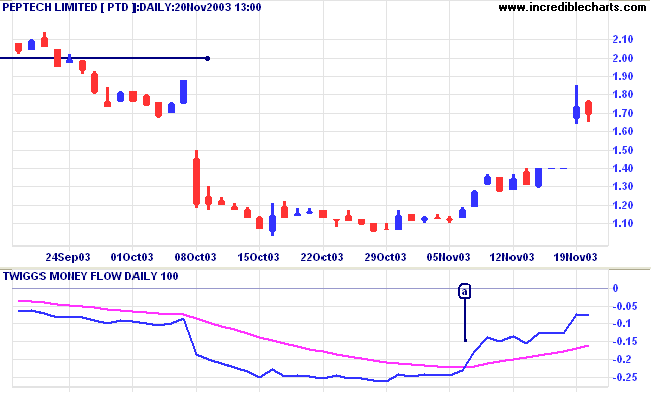
There was a similar rise on Relative Strength (xao), followed by
higher troughs above the new RS support level at [b]; a strong
bull signal.
Understanding
the Trading Diary has been expanded to offer further
assistance to readers, including directions on how to search the
archives.
Colin Twiggs
The man who can master his time can master nearly anything.
~ Winston Churchill
~ Winston Churchill
US charts
We have completed the transfer to the new dual-CPU server
and expect to have US charts available this week.
Back Issues
You can now view back issues at the Daily Trading Diary Archives.
You can now view back issues at the Daily Trading Diary Archives.
Back Issues
Access the Trading Diary Archives.

Author: Colin Twiggs is a former investment banker with almost 40 years of experience in financial markets. He co-founded Incredible Charts and writes the popular Trading Diary and Patient Investor newsletters.
Using a top-down approach, Colin identifies key macro trends in the global economy before evaluating selected opportunities using a combination of fundamental and technical analysis.
Focusing on interest rates and financial market liquidity as primary drivers of the economic cycle, he warned of the 2008/2009 and 2020 bear markets well ahead of actual events.
He founded PVT Capital (AFSL No. 546090) in May 2023, which offers investment strategy and advice to wholesale clients.