|
ETOs and
Warrants We are still on target to introduce ETOs and warrants this week. US stocks to follow. |
Trading Diary
October 8, 2003
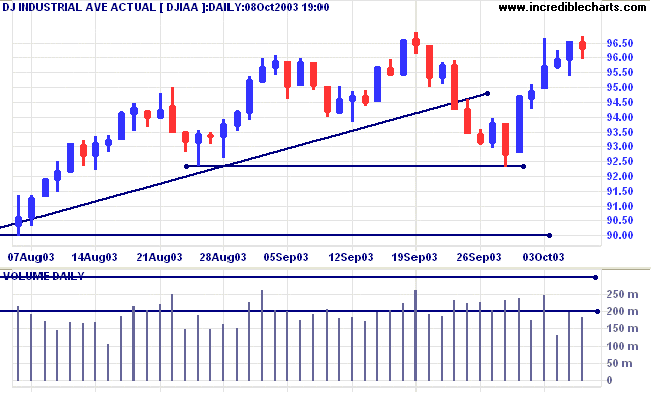
The intermediate trend is down. A rise above resistance at 9686 will signal reversal.
The primary trend is up. A fall below 9000 will signal reversal.
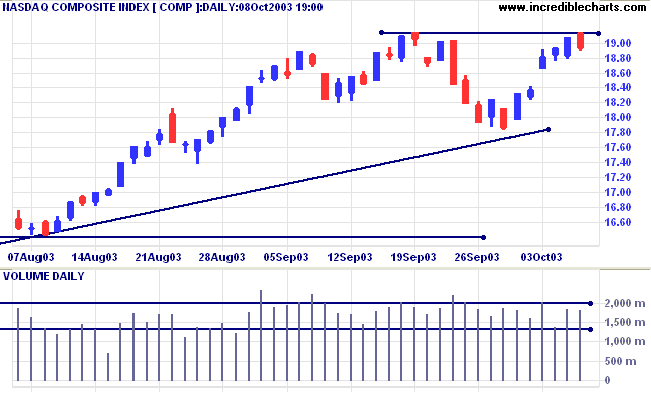
The intermediate trend is down. A rise above resistance at 1914 will signal reversal.
The primary trend is up. A fall below 1640 will signal reversal.
The intermediate trend is weak. A rise above resistance at 1040 will signal resumption of the up-trend.
The primary trend is up. A fall below 960 will signal reversal.
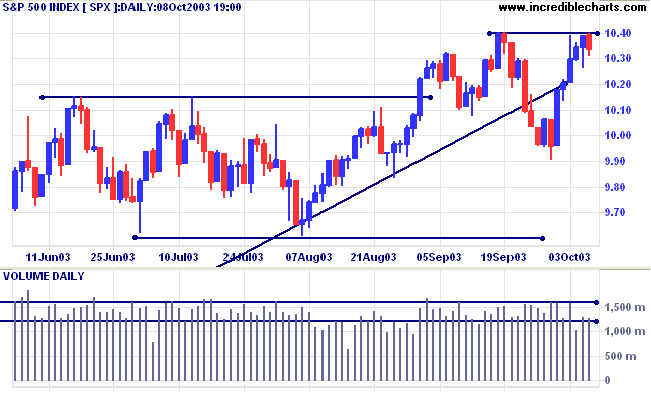
Short-term: Bullish if the S&P500 is above 1040. Bearish below 1020.
Intermediate: Bullish above 1040.
Long-term: Bullish above 960.
The US dollar slipped to within one cent of its all-time low of $1.185 against the euro. (more)
The yield on 10-year treasury notes is unchanged at 4.24%.
The intermediate down-trend appears weak.
The primary trend is up.
New York (17:57): Spot gold eased to $374.80.
The intermediate trend is down.
The primary trend is up. A fall below 350 will signal reversal.
The target for the symmetrical triangle is calculated as 426 (365 + 382 - 321), but expect heavy resistance between 400 and 415 (the 10-year high).
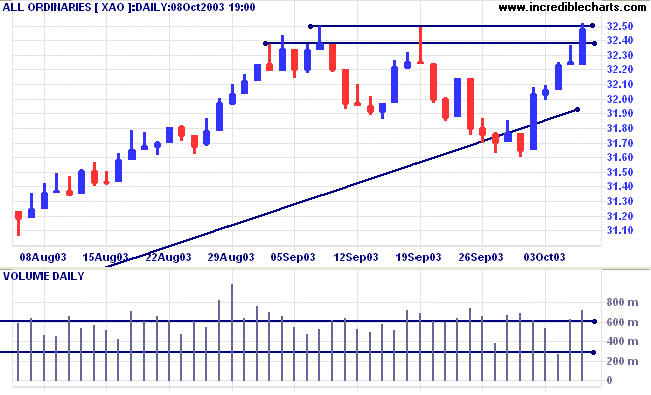
The primary trend is up. A fall below 3000 will signal reversal.
MACD (26,12,9) is above its signal line; Slow Stochastic (20,3,3) is above; Twiggs Money Flow (21) has turned up, but still signals distribution.
Short-term: Bullish if the All Ords is above 3250. Bearish below 3223.
Intermediate: Bullish above 3250.
Long-term: Bullish above 3000.
Last covered September 29, 2003.
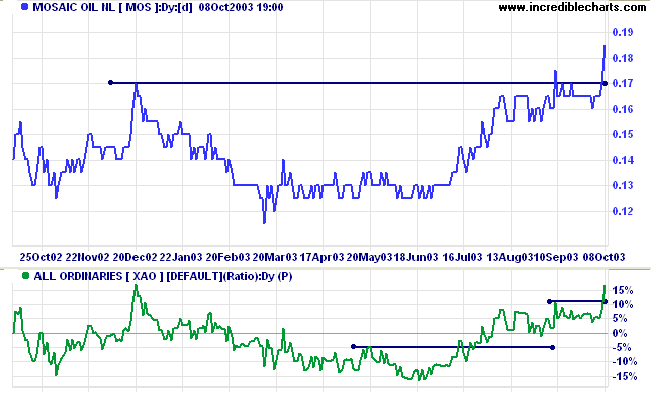
After forming a broad base MOS has broken through resistance to form a new 1-year high.
Twiggs Money Flow has formed a trough above zero; a strong bull signal.
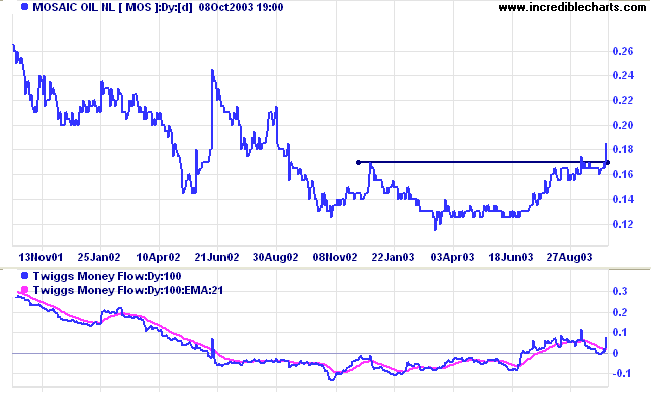
A pull-back that respects the new support level at 0.17 may present entry opportunities. A fall below 0.16 would be bearish.
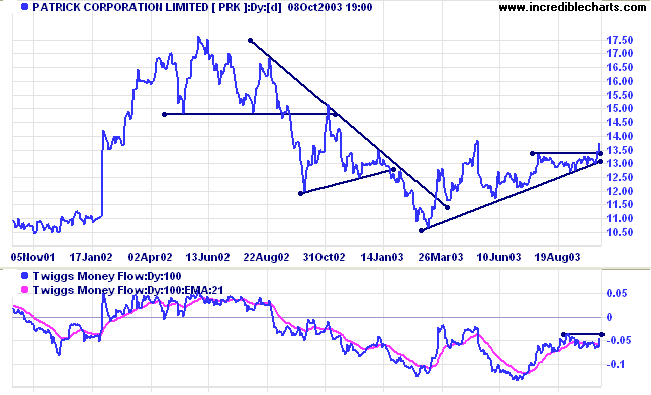
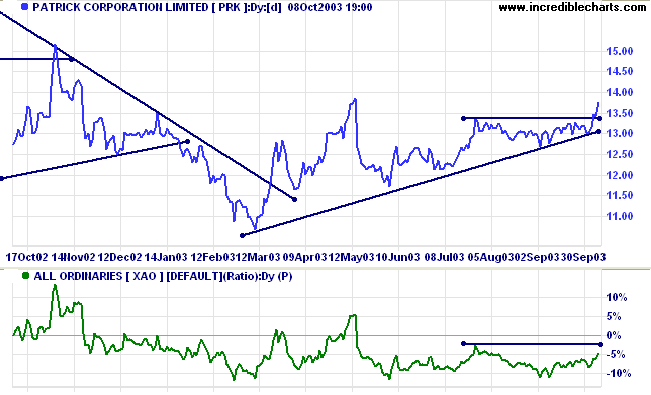
Patrick has formed a base in the shape of a symmetrical triangle. Price has now broken above the base.
Twiggs Money Flow (100) has yet to resume its upward rise, making new highs.
Last covered October 1, 2002.
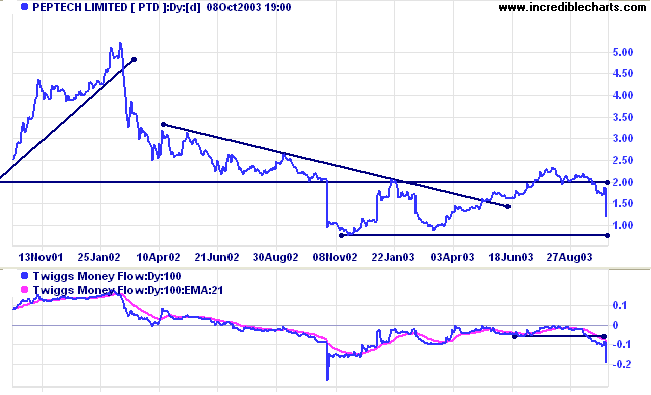
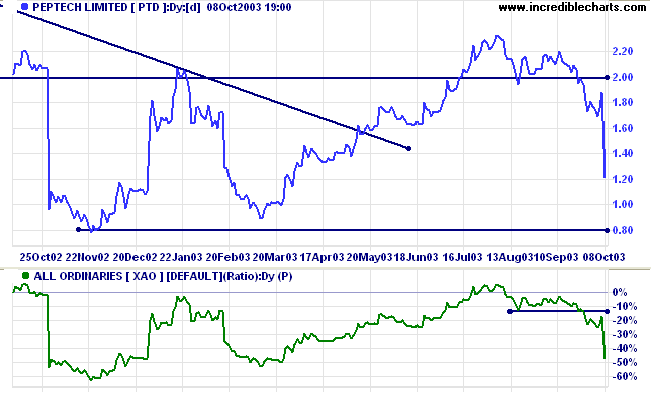
Peptech appears headed for a re-test of support at 0.80. After breaking above resistance at 2.00, price struggled to make further gains, forming a lower high followed by a break below the support level.
Twiggs Money Flow (100) has also made new lows.
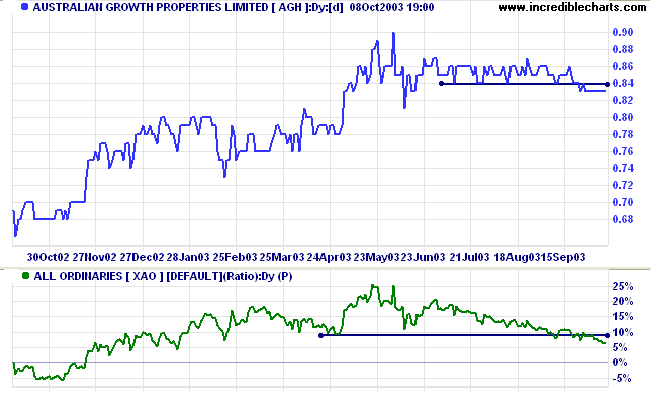
After reaching a new 5-year high, above 0.85, AGH has consolidated at this level, normally a bullish sign, but Twiggs Money Flow (100) displays a bearish divergence.
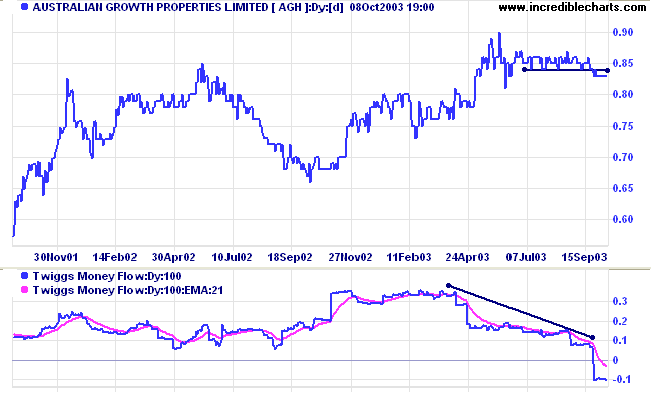
A rise above 0.90 would be bullish. A fall below 0.79 will be a strong bear signal.
There are sub-groups, such as day-traders, swing traders and long-term (Weinstein) traders,
but the differences, to an outsider, appear relatively minor.
It is important to identify the assumptions and assertions on which the group is based
and to recognize the strong pressures to conform.
How do we react to people who challenge those assumptions?
If group leaders, such as Stan Weinstein or other gurus, say that this is a bull market,
are you likely to maintain a contrary view?
It is important to avoid group-think and being swept along with the herd.
|
If you display the legend on a chart,
click on an indicator name and this will display the
relevant Indicator help page. For example, click on Volume:Dy and you will be linked to https://www.incrediblecharts.com/indicators/volume.php. Likewise, if you have an indicator selected on the Indicator Panel, click on the Indicator name in the centre panel and it will display the Indicator help page. |
You can now view back issues at the Daily Trading Diary Archives.
Back Issues

Author: Colin Twiggs is a former investment banker with almost 40 years of experience in financial markets. He co-founded Incredible Charts and writes the popular Trading Diary and Patient Investor newsletters.
Using a top-down approach, Colin identifies key macro trends in the global economy before evaluating selected opportunities using a combination of fundamental and technical analysis.
Focusing on interest rates and financial market liquidity as primary drivers of the economic cycle, he warned of the 2008/2009 and 2020 bear markets well ahead of actual events.
He founded PVT Capital (AFSL No. 546090) in May 2023, which offers investment strategy and advice to wholesale clients.
