| Searching the Trading Diary Archives | |
| Use the normal Search function at the top of the website page. | |
| 1. |
Search for the name rather than the code (eg. ALL will include the All Ordinaries and Small Caps Index, whereas Aristocrat is more specific). |
| 2. | Include a + sign before each required field. |
| 3. | Include +"back issues" to narrow the search to the Trading Diary. |
| 4. | If you want listings for a specific year (eg. 2003), add that to the search field. |
|
EXAMPLE To search for Aristocrat, enter +aristocrat +"back issues" 2003 in the search field. |
|
Trading Diary
July 14, 2003
These extracts from my daily trading diary are
intended to illustrate the techniques used in short-term trading
and should not be interpreted as investment advice. Full terms
and conditions can be found at Terms
of Use .
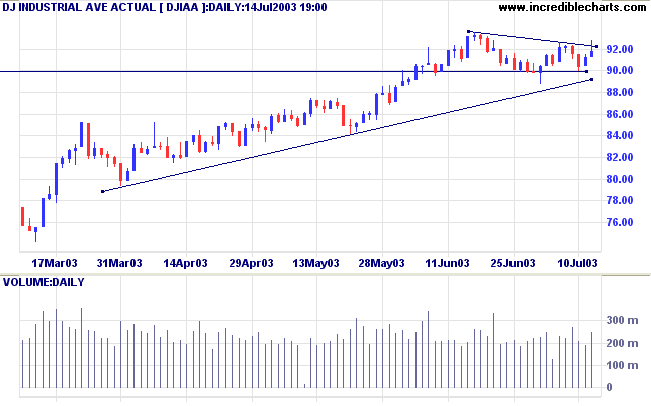
USA
The Dow rallied strongly in early trading but retreated to make a weak close at 9177 on strong volume. Two equal highs below a previous high is a bearish signal.
The intermediate trend is up. A decline below 8978 will signal a down-turn.
The primary trend is up.
The Dow rallied strongly in early trading but retreated to make a weak close at 9177 on strong volume. Two equal highs below a previous high is a bearish signal.
The intermediate trend is up. A decline below 8978 will signal a down-turn.
The primary trend is up.
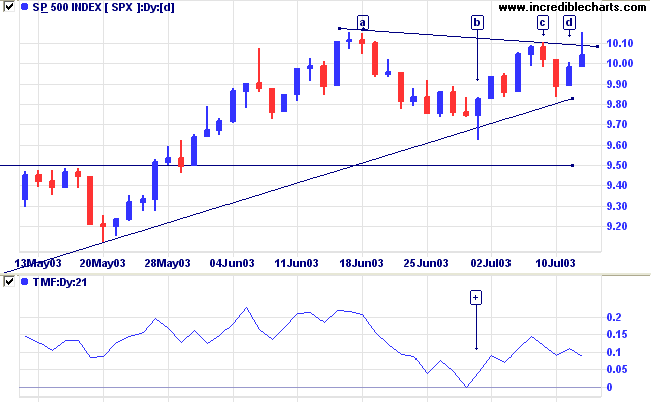
The S&P 500 tested resistance at 1015
before retreating sharply to close 5 points up at 1003.
The intermediate trend is up. A fall below 962 will signal a down-turn.
The primary trend is up.
The intermediate trend is up. A fall below 962 will signal a down-turn.
The primary trend is up.
The Nasdaq Composite gapped up at the opening
but failed to make further progress, closing 1.2% higher at
1754.
The intermediate trend is up.
The primary trend is up.
The intermediate trend is up.
The primary trend is up.
The Chartcraft NYSE Bullish % Indicator rose to 76.19%
on July 11.
Market Strategy
Short-term: Long if the
S&P 500 is above 1015. Short if the index falls below
962.
Intermediate: Long if the S&P is above 1015.
Long-term: Long.
Intermediate: Long if the S&P is above 1015.
Long-term: Long.
Tech lift
Strong results are expected from Intel on Tuesday, with earnings forecast at 13 cents for the quarter, compared to 9 cents a year earlier. (more)
Strong results are expected from Intel on Tuesday, with earnings forecast at 13 cents for the quarter, compared to 9 cents a year earlier. (more)
Gold
New York (17.50): Spot gold has recovered to $US 347.20.
On the five-year chart gold is above the long-term upward trendline.
New York (17.50): Spot gold has recovered to $US 347.20.
On the five-year chart gold is above the long-term upward trendline.
ASX Australia
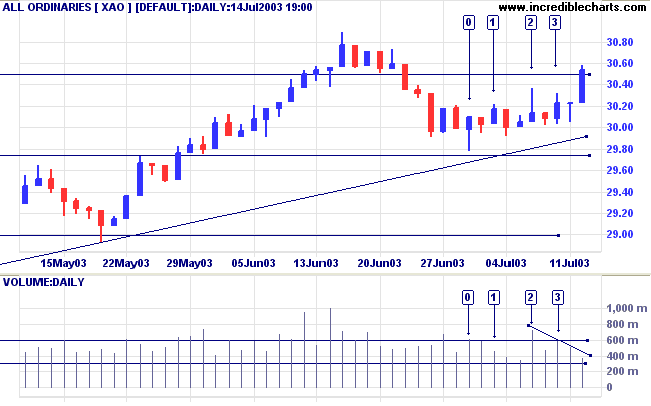
The All Ordinaries rallied strongly to close up
30 points at 3053. Volume was disappointingly weak and we may see
a re-test of support at 2980, especially after the failure of the
US markets to make much headway.
The intermediate trend is up.
The primary trend is up.
MACD (26,12,9) threatens to cross above its signal line; Slow Stochastic (20,3,3) is above; Twiggs Money Flow (21) signals accumulation.
The intermediate trend is up.
The primary trend is up.
MACD (26,12,9) threatens to cross above its signal line; Slow Stochastic (20,3,3) is above; Twiggs Money Flow (21) signals accumulation.
Market Strategy
Short-term: Long if the All Ords is above 3089.
Short if below 2978.
Intermediate: The primary trend is up; Long if the All Ords is above 3089.
Long-term: Long.
Intermediate: The primary trend is up; Long if the All Ords is above 3089.
Long-term: Long.
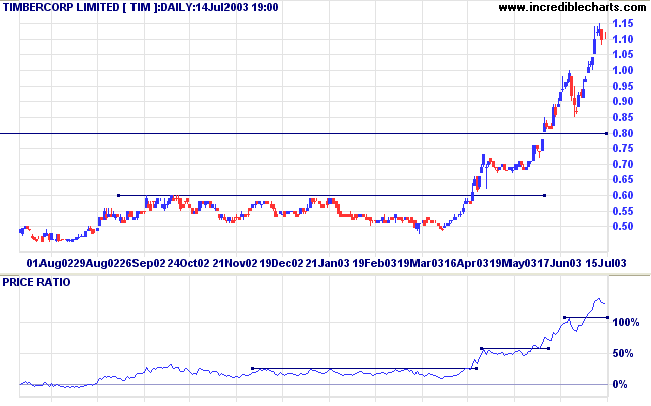
Timbercorp [TIM]
Timbercorp has the highest 3-month relative strength of all ASX 200 stocks.
The stock presents an excellent example of a stage 1 breakout and is worth examination.
After a narrow bottom in 2001, TIM doubled to 0.80 before retreating to re-test support and build a broad stage 1 base.
Every primary trend breakout must form a new 3-month high and I find the 3-month % Of Price High stock screen a useful starting point.
Twiggs Money Flow (100-day) is rising strongly, while MACD has completed two bullish troughs [+] above zero.
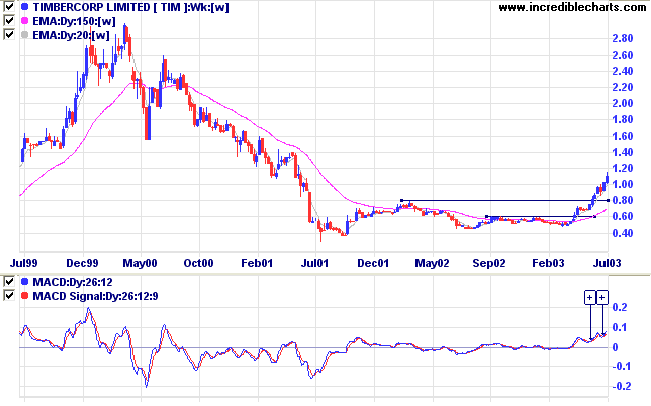
Relative Strength (price ratio: xao) made a new
3-month high, confirming the breakout at 0.60. The indicator has
gone from strength to strength, making repeated new highs in the
next 4 months.
The initial breakout at [a] was on strong volume
but had a fairly weak close. Any entries at this point should
have a stop loss below the low from the previous day.
The short-term trend then pulled back at [b] to test support. The duration was short and volume dried up, presenting further entry opportunities for short-term traders.
Price then peaked at [c] before re-testing support at [d]. Strong buying support is evident at [d] with heavy volume and a long shadow/weak close.
Instead of retreating further, price then formed a narrow line or trading range, signaling strong accumulation, especially when it occurs above support during a rally. This pattern presented an opportunity for short, medium and long-term traders to increase their positions.
Two equal lows in the range at [e] and [f] are a further bull signal, especially as volume dried up on the second low.
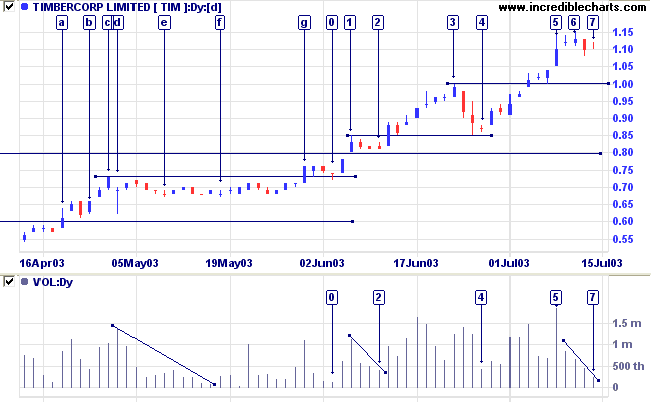
The next breakout at [g] was followed by a
dry-up of volume on the pull-back at [0]; a pattern that was
repeated at [2], [4] and [7]. The pull-backs exhibited further
bull signals, being of short duration and with a dry up of the
daily range (volatility). Further, each pull-back respected the
first support level, the high of the previous up-swing (at [g],
[1] and [3]), signaling a powerful up-trend.
These presented further opportunities for short-term traders to increase their positions; intermediate traders may have also done so at [4].
Back Issues
These presented further opportunities for short-term traders to increase their positions; intermediate traders may have also done so at [4].
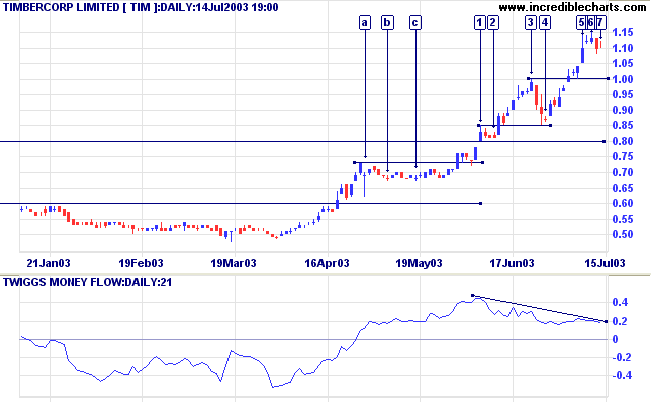
TIM has made an excellent rally, almost
doubling in price from the breakout at 0.60.
It may be time to heed some of the warning signs that the trend may be over-extending itself: Twiggs Money Flow (21-day) displays a strong bearish divergence from [1] to [6].
It may be time to heed some of the warning signs that the trend may be over-extending itself: Twiggs Money Flow (21-day) displays a strong bearish divergence from [1] to [6].
At some point the stock will pull back to
re-test support levels and intermediate and long-term traders
would do well to lock in profits and avoid taking further long
positions until then.
It would be over-cautious to close existing positions while the trend is still strong.
Just stay alert for bear signals such as trendline breaks or strong reversal days with big volume.
It would be over-cautious to close existing positions while the trend is still strong.
Just stay alert for bear signals such as trendline breaks or strong reversal days with big volume.
Understanding
the Trading Diary has been expanded to offer further
assistance to readers.
Colin Twiggs
He who loses money loses much;
He who loses a friend loses more,
But he who loses his spirit loses all.
~ Wall Street maxim
S.A. Nelson: The ABC of Stock Speculation (1902).
He who loses a friend loses more,
But he who loses his spirit loses all.
~ Wall Street maxim
S.A. Nelson: The ABC of Stock Speculation (1902).
Stock Screens: Relative Strength
You can use % Price Move to display Relative Strength.
To calculate 3-month RS for the ASX 200:
(1) Select ASX 200 from Indices and Watchlists and 200 as the Maximum Return;
You can use % Price Move to display Relative Strength.
To calculate 3-month RS for the ASX 200:
(1) Select ASX 200 from Indices and Watchlists and 200 as the Maximum Return;
(2) Enter 999
as the 3-month Maximum % Price Move;
(3)Submit;
(4) Sort the Return by clicking on the %M(3M) header.
Stocks with the highest RS will be at the top of the list.
(3)Submit;
(4) Sort the Return by clicking on the %M(3M) header.
Stocks with the highest RS will be at the top of the list.
Back
Issues
You can now view back issues at the Daily Trading Diary Archives.
You can now view back issues at the Daily Trading Diary Archives.
Back Issues
Access the Trading Diary Archives.

Author: Colin Twiggs is a former investment banker with almost 40 years of experience in financial markets. He co-founded Incredible Charts and writes the popular Trading Diary and Patient Investor newsletters.
Using a top-down approach, Colin identifies key macro trends in the global economy before evaluating selected opportunities using a combination of fundamental and technical analysis.
Focusing on interest rates and financial market liquidity as primary drivers of the economic cycle, he warned of the 2008/2009 and 2020 bear markets well ahead of actual events.
He founded PVT Capital (AFSL No. 546090) in May 2023, which offers investment strategy and advice to wholesale clients.