|
Incredible Charts version
4.0.2.500 The new version is now available. Check Help>>About to ensure that your software has been automatically updated. The update offers further improvements to the watchlist menu, powerful new scrolling features and supports the use of Large Font settings on laptop (and desktop) computers. See What's New? for further details. |
Trading Diary
September 11, 2003
These extracts from my daily trading diary
are for educational purposes
only and should not be
interpreted as investment advice. Full terms and conditions can
be found at Terms
of Use .
USA
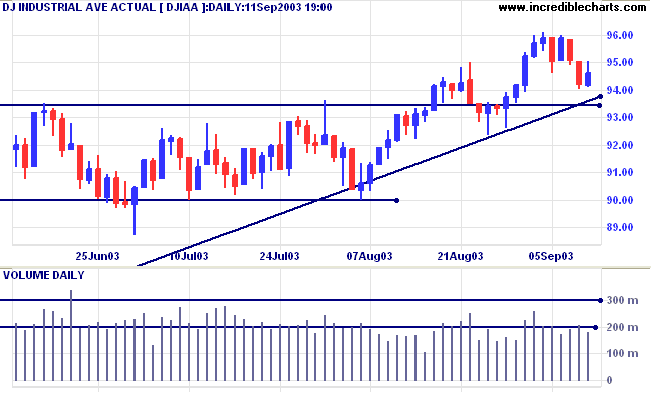
The Dow Industrial Average gained 0.4% to close at 9460. The weak
close and low volume indicate that there may still be a test of
support at 9350.
The intermediate trend is up. Continued low volume signals trend weakness.
The primary trend is up.
The intermediate trend is up. Continued low volume signals trend weakness.
The primary trend is up.
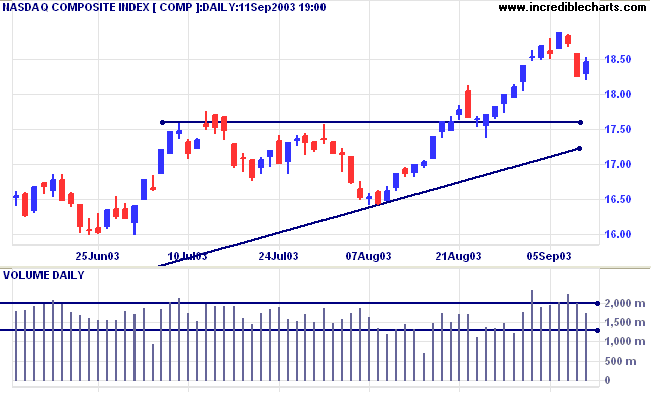
The Nasdaq Composite recovered 22 points to close at 1846 on
reasonable volume.
The intermediate trend is up.
The primary trend is up.
The intermediate trend is up.
The primary trend is up.
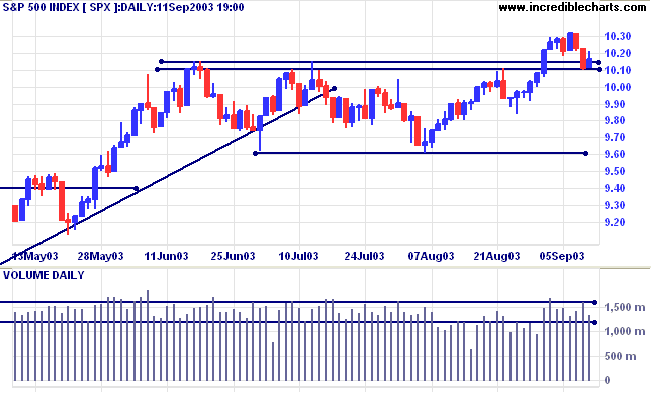
The S&P 500 regained 5 points to close at 1016, forming an
inside day on lower volume. A close below 1010 will signal a
re-test of support at 960.
The intermediate trend is up.
The primary trend is up.
The intermediate trend is up.
The primary trend is up.
The Chartcraft NYSE Bullish % Indicator retreated
0.45% to 79.66% (September 10).
Market Strategy
Short-term: Long if the S&P500 is above 1023.
Intermediate: Long if S&P 500 is above 1023.
Long-term: Long is the index is above 960.
Short-term: Long if the S&P500 is above 1023.
Intermediate: Long if S&P 500 is above 1023.
Long-term: Long is the index is above 960.
Jobless claims are up
New unemployment claims increased to 422,000 last week, back above the 400K threshold for a shrinking job market. (more)
New unemployment claims increased to 422,000 last week, back above the 400K threshold for a shrinking job market. (more)
Treasury yields
The yield on 10-year treasury notes steadied at 4.33%.
The primary trend is up.
The yield on 10-year treasury notes steadied at 4.33%.
The primary trend is up.
Gold
New York (19.51): Spot gold dipped briefly to 374 before recovering to $379.10.
The primary trend is up.
Price has broken above a symmetrical triangle formed since the start of the year. If gold penetrates overhead resistance at 382, the target is the 10-year high of 420.
New York (19.51): Spot gold dipped briefly to 374 before recovering to $379.10.
The primary trend is up.
Price has broken above a symmetrical triangle formed since the start of the year. If gold penetrates overhead resistance at 382, the target is the 10-year high of 420.
ASX Australia
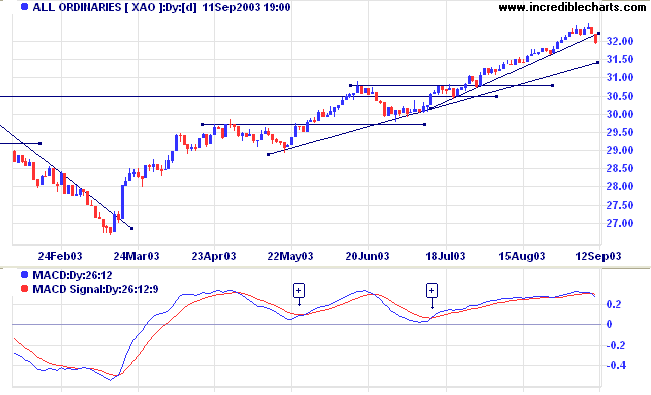
The All Ordinaries lost 23 points to close at 3197 on strong
volume, headed for the long-term trendline.
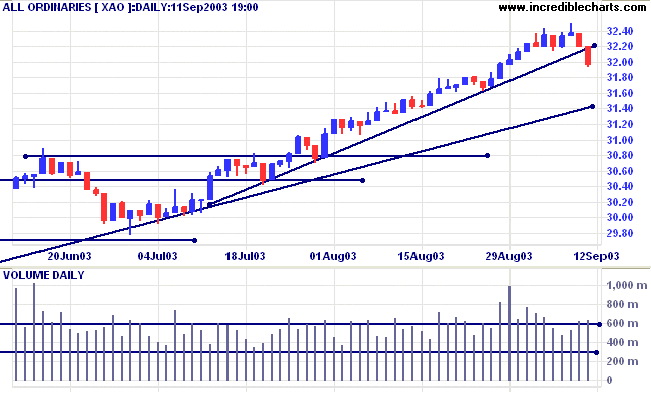
The intermediate and primary trends are up.
MACD (26,12,9) has crossed to below its signal line, forming a bearish divergence; Slow Stochastic (20,3,3) has whipsawed below its signal line; and Twiggs Money Flow shows a bearish divergence.
MACD (26,12,9) has crossed to below its signal line, forming a bearish divergence; Slow Stochastic (20,3,3) has whipsawed below its signal line; and Twiggs Money Flow shows a bearish divergence.
Market Strategy
Short-term: Long above 3220.
Intermediate: Long if the index is above 3160.
Long-term: Long if the index is above 2978.
Short-term: Long above 3220.
Intermediate: Long if the index is above 3160.
Long-term: Long if the index is above 2978.
Utilities
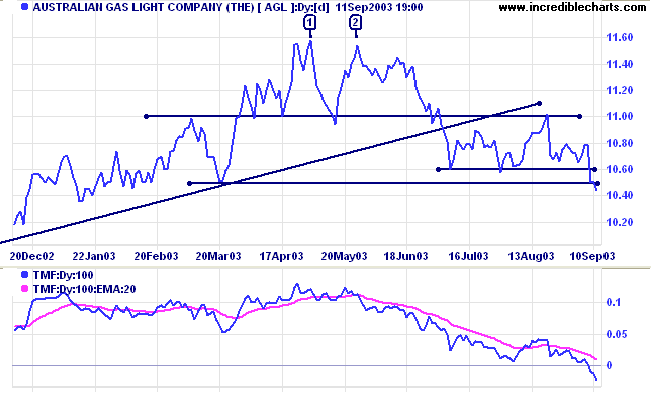
Australian Gas Light [AGL] was last covered on September 4, 2003.
Price has closed below the 10.50 support level on reasonable volume, a strong bear signal.
Relative Strength is falling; MACD is bearish and Twiggs Money Flow (100) has crossed below zero.
Australian Gas Light [AGL] was last covered on September 4, 2003.
Price has closed below the 10.50 support level on reasonable volume, a strong bear signal.
Relative Strength is falling; MACD is bearish and Twiggs Money Flow (100) has crossed below zero.
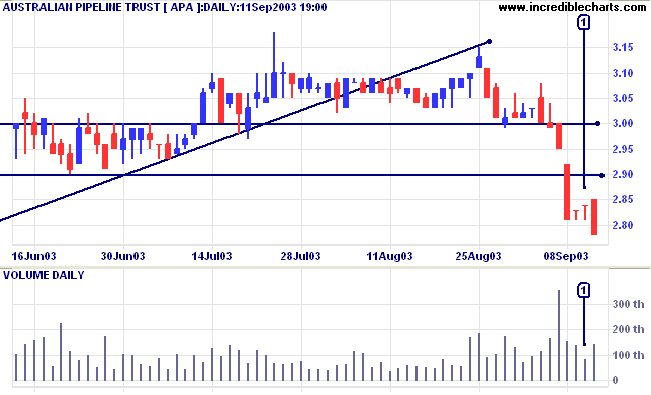
Australian Pipeline Trust [APA] was also covered on September 4, 2003.
Price has penetrated support at 3.00 and again at 2.90, a more critical level. The short correction on low volume at [1] signals a fast down-trend.
Relative Strength has fallen sharply; Twiggs Money Flow (100) has swung to signal distribution; and MACD shows a bearish divergence.
Price has penetrated support at 3.00 and again at 2.90, a more critical level. The short correction on low volume at [1] signals a fast down-trend.
Relative Strength has fallen sharply; Twiggs Money Flow (100) has swung to signal distribution; and MACD shows a bearish divergence.
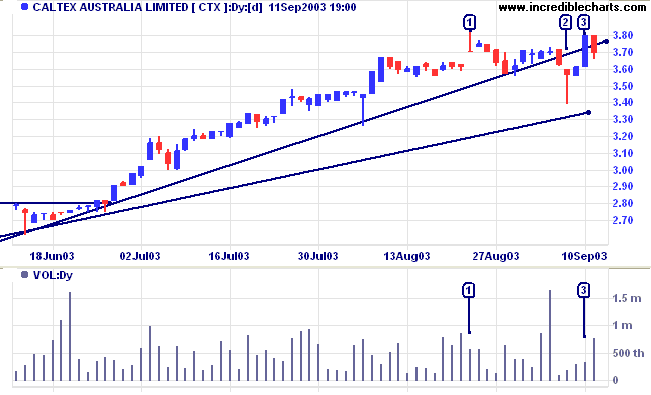
Caltex Australia [CTX]
Last covered on August 7, 2003, CTX has been in a strong intermediate up-trend before breaking the intermediate trendline, to signal a loss of momentum.
Relative Strength is rising. Twiggs Money Flow and MACD are declining but still bullish.
Last covered on August 7, 2003, CTX has been in a strong intermediate up-trend before breaking the intermediate trendline, to signal a loss of momentum.
Relative Strength is rising. Twiggs Money Flow and MACD are declining but still bullish.
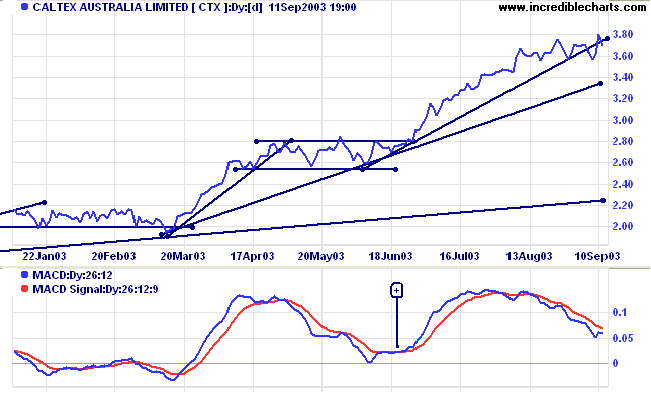
Equal highs at [1] and [3] are not particularly bearish, unless
there is a break below the low of [2].
Health Care Distributors & Services
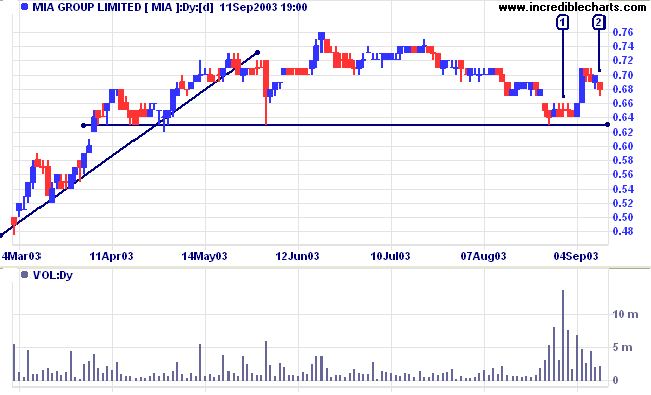
MIA Group [MIA] was last covered on May 20,2003. Price shows a rounded top after a sharp V-bottom rally.
Relative Strength and MACD are bearish but Twiggs Money Flow (100) still signals accumulation.
MIA Group [MIA] was last covered on May 20,2003. Price shows a rounded top after a sharp V-bottom rally.
Relative Strength and MACD are bearish but Twiggs Money Flow (100) still signals accumulation.
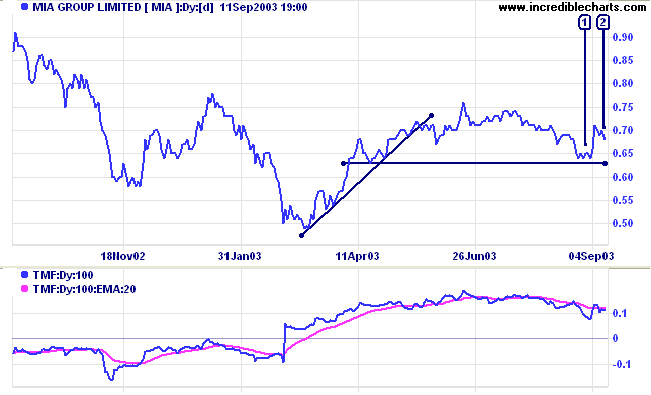
Strong volume at [1] signals buying support at 0.63/0.64. The
rally only lasted one day and volume was lighter, signaling
another test of the support level. A dry up of volume while
holding above the support level will be a bullish sign, while a
close below 0.63 will be a strong bear signal.
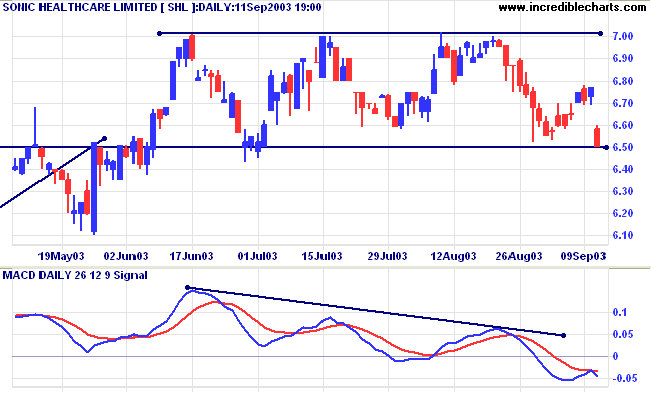
Sonic Health Care [SHL] was last covered June 2, 2003, when price was consolidating
below resistance at 6.50. Since then we have had a breakout but
the rally ended at 7.00 and price is now stuck in a narrow range
between 6.50 and 7.00.
Relative Strength and Twiggs Money Flow are falling.
Relative Strength and Twiggs Money Flow are falling.
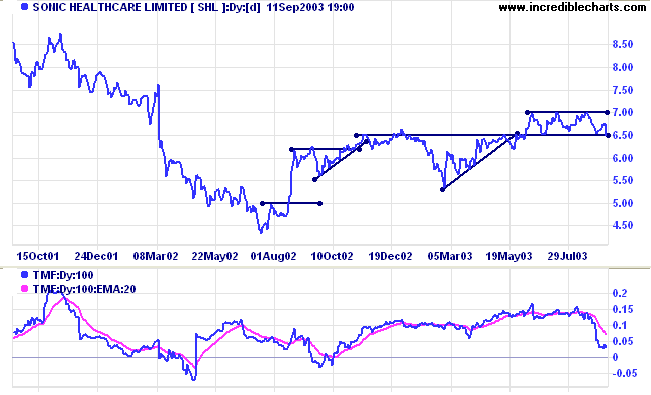
Consolidation above a support level is generally a bullish sign
but MACD shows a bearish divergence. Volume has not provided any
additional clues as to the direction of the breakout.
Price is now testing support at 6.50 and a close below this level will be a bear signal, confirmed by a fall below 6.43.
A break above 7.00 would be a bull signal.
Price is now testing support at 6.50 and a close below this level will be a bear signal, confirmed by a fall below 6.43.
A break above 7.00 would be a bull signal.
Understanding
the Trading Diary has been expanded to offer further
assistance to readers.
Colin Twiggs
A stockbroker is someone who invests your money
until it is all gone.
~ Woody Allen.
~ Woody Allen.
Saving Chart Images
|
Chart Images are saved at a default size
of 651 x 395 pixels, for use on the Chart Forum. To alter the Default size, select File >> Set Image Size and enter the new dimensions, keeping to the same ratio (651/395). See Saving Charts for further details. |
Back Issues
You can now view back issues at the Daily Trading Diary Archives.
You can now view back issues at the Daily Trading Diary Archives.
Back Issues
Access the Trading Diary Archives.

Author: Colin Twiggs is a former investment banker with almost 40 years of experience in financial markets. He co-founded Incredible Charts and writes the popular Trading Diary and Patient Investor newsletters.
Using a top-down approach, Colin identifies key macro trends in the global economy before evaluating selected opportunities using a combination of fundamental and technical analysis.
Focusing on interest rates and financial market liquidity as primary drivers of the economic cycle, he warned of the 2008/2009 and 2020 bear markets well ahead of actual events.
He founded PVT Capital (AFSL No. 546090) in May 2023, which offers investment strategy and advice to wholesale clients.