This issue of the daily Trading Diary
is exclusive to Premium members.
Free Trials entered in April 2003 have expired but the discount price is extended for 10 days
to accommodate members waiting for ETOs and warrants.
Trading Diary
June 2, 2003
These extracts from my daily trading diary are
intended to illustrate the techniques used in short-term trading
and should not be interpreted as investment advice. Full terms
and conditions can be found at Terms
of Use .
USA
The Dow tested resistance at 9000 before retreating back to close at 8897 on higher volume.
The intermediate trend is up.
A close above 9000 will signal the start of a primary up-trend.
The Dow tested resistance at 9000 before retreating back to close at 8897 on higher volume.
The intermediate trend is up.
A close above 9000 will signal the start of a primary up-trend.
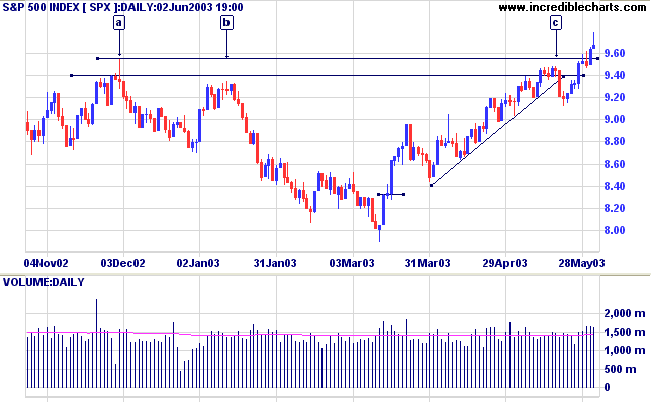
The S&P 500 completed a gravestone
candlestick similar to the Dow, signaling short-term
weakness. The index closed 4 points up at 967.
The intermediate trend is up.
The primary trend is above 954 [a], signaling an up-trend.
The intermediate trend is up.
The primary trend is above 954 [a], signaling an up-trend.
The Nasdaq Composite formed a closing price reversal; down 0.3%
at 1590.
The intermediate trend is up.
The index is in a primary up-trend.
The intermediate trend is up.
The index is in a primary up-trend.
The Chartcraft NYSE Bullish % Indicator leapt
almost 1.5% to 66.45% on May 30; following a Bull
Correction buy signal (April 3).
Market Strategy
Short-term: Long if the S&P 500 is above 954.
Intermediate: Long - the primary trend has turned upwards (S&P above 954).
Long-term: There are already two bull signals: the March 17 follow through day and the April 3 NYSE Bullish % signal. Go long - the S&P 500 primary trend has turned upwards.
Intermediate: Long - the primary trend has turned upwards (S&P above 954).
Long-term: There are already two bull signals: the March 17 follow through day and the April 3 NYSE Bullish % signal. Go long - the S&P 500 primary trend has turned upwards.
Manufacturing contraction slows
The Institute for Supply Management's index of manufacturing activity rose to 49.4, from 45.4 in April. The figure is above expectations but still below 50, indicating contraction. (more)
The Institute for Supply Management's index of manufacturing activity rose to 49.4, from 45.4 in April. The figure is above expectations but still below 50, indicating contraction. (more)
Gold
New York (17.45): Spot gold improved to $US 365.50.
On the five-year chart gold is above the long-term upward trendline.
New York (17.45): Spot gold improved to $US 365.50.
On the five-year chart gold is above the long-term upward trendline.
ASX Australia
The monthly Coppock indicator has turned up below zero, signaling
the start of a bull market, while the XAO has broken above the
long-term downward trendline.
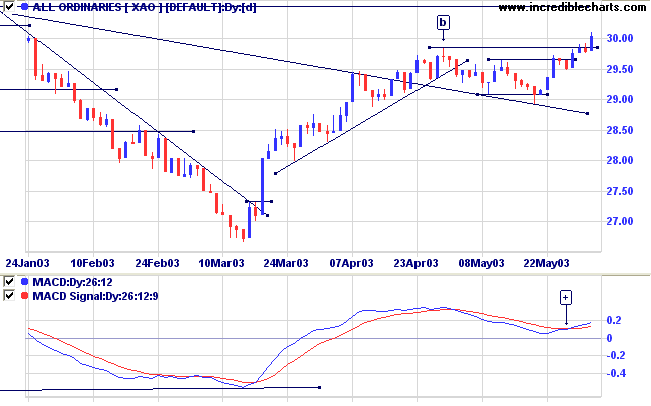
The All Ordinaries rallied strongly, closing above the 2984
resistance level; at 3004 on surprisingly low volume.
The intermediate trend is up.
The primary trend is down. A close above 3050 will signal an up-trend.
MACD (26,12,9) is above its signal line, completing a bullish trough above zero at [+]; Slow Stochastic (20,3,3) is above its signal line; and Twiggs Money Flow (21) shows accumulation.
The intermediate trend is up.
The primary trend is down. A close above 3050 will signal an up-trend.
MACD (26,12,9) is above its signal line, completing a bullish trough above zero at [+]; Slow Stochastic (20,3,3) is above its signal line; and Twiggs Money Flow (21) shows accumulation.
Market Strategy
Short-term: Long if the All Ords is above [b] at 2984; short if
the XAO falls below 2908.
Intermediate: Long if the primary trend reverses up ( closes above 3050 ); short if the XAO is below 2908.
Long-term: There is already a bull signal: the March 18 follow through. Wait for confirmation from a primary trend reversal.
Intermediate: Long if the primary trend reverses up ( closes above 3050 ); short if the XAO is below 2908.
Long-term: There is already a bull signal: the March 18 follow through. Wait for confirmation from a primary trend reversal.
Health Care
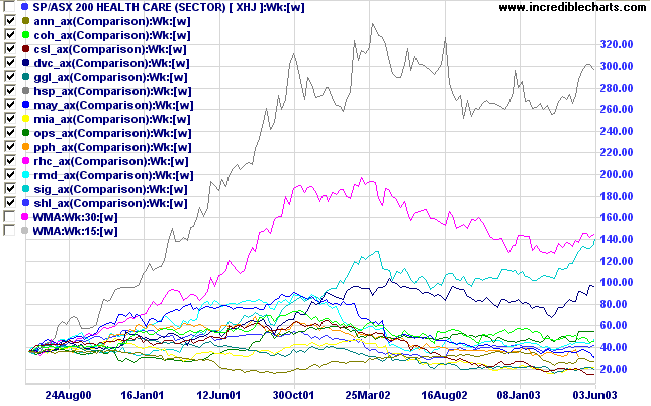
A reader mentioned Sonic Health Care [SHL] last week.
If we look at the Health Care sector, Sigma is the only stock that has reached new highs on the 3-year sector comparison chart. The rest of the sector is stuck in the doldrums.
A reader mentioned Sonic Health Care [SHL] last week.
If we look at the Health Care sector, Sigma is the only stock that has reached new highs on the 3-year sector comparison chart. The rest of the sector is stuck in the doldrums.
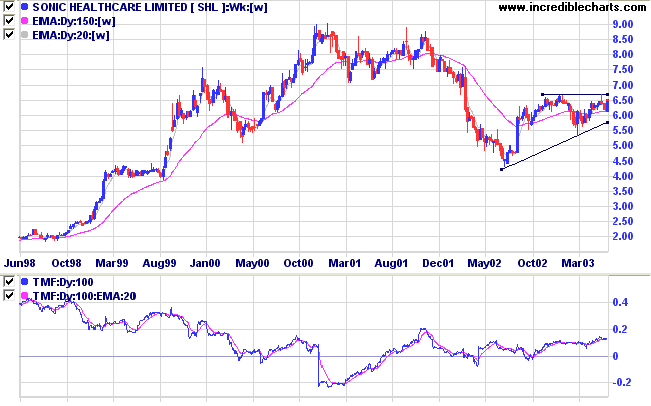
SHL is typical of the sector, it has rallied off its lows but
struggles to break through resistance.
Twiggs Money Flow (100) signals accumulation and a close above 6.63 will be bullish; but this may take a while.
A fall below 5.35 would be bearish.
Twiggs Money Flow (100) signals accumulation and a close above 6.63 will be bullish; but this may take a while.
A fall below 5.35 would be bearish.
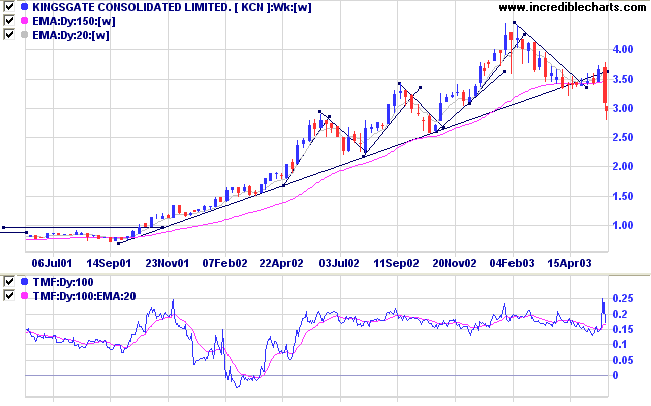
Kingsgate [KCN]
Last covered on March 26, 2003.
KCN has made a sharp break below the
long-term trendline, while Twiggs Money Flow (100) continues to
signal accumulation.Last covered on March 26, 2003.
The close below the April low signals a change in the primary trend.
The rule with any indicator is: When you summarize, you
sacrifice.
Every indicator highlights certain patterns but omits others. There is no indicator that embodies all the behavior visible on the price and volume chart.
On the equivolume chart the over-square bar at [1] is a clear indication of heavy resistance. The break below the low of [1], on day [2], is a strong reversal signal.
The power bar down at [3] broke below support at 3.42 and again at 3.20.
The latest bar at [4] shows lighter volume and a long shadow; the market is catching its breath before deciding what further direction to take.
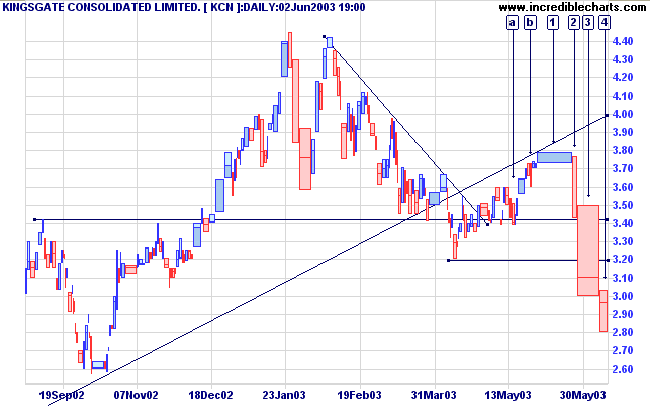
This brings me to my favorite subject - stop losses.
After a day like [1] short-term traders should have their stop below the low of [1], or [b] at the lowest.
Anyone other than a short-term trader should not be taking long entries in a stock below its primary upward trendline.
Anyone who does not have a stop loss in place should not be trading - it's like tightrope walking without a safety net.
Understanding
the Trading Diary has been expanded to offer further
assistance to readers.
Colin Twiggs
There is a tide in the affairs
of men,
which, taken at the flood,
leads on to fortune.
- William Shakespeare: Julius Caesar
which, taken at the flood,
leads on to fortune.
- William Shakespeare: Julius Caesar
Back Issues
Click here to access the Trading Diary Archives.
Click here to access the Trading Diary Archives.

Author: Colin Twiggs is a former investment banker with almost 40 years of experience in financial markets. He co-founded Incredible Charts and writes the popular Trading Diary and Patient Investor newsletters.
Using a top-down approach, Colin identifies key macro trends in the global economy before evaluating selected opportunities using a combination of fundamental and technical analysis.
Focusing on interest rates and financial market liquidity as primary drivers of the economic cycle, he warned of the 2008/2009 and 2020 bear markets well ahead of actual events.
He founded PVT Capital (AFSL No. 546090) in May 2023, which offers investment strategy and advice to wholesale clients.