If you activated your free trial when the Premium version was first introduced,
you may notice that your free trial has expired but that you still have access to Premium data.
We will shortly introduce US indexes and hourly updates for ASX stocks
The free trial period has been extended to fit in with this.
Trading Diary
May 20, 2003
The intermediate upward trendline has been broken, signaling weakness.
The primary trend is down; a rise above 9076 will signal a reversal.
The intermediate upward trendline is broken, signaling weakness.
The primary trend is down; a rise above 954 will signal an up-trend.
The intermediate trend is up, but weakening.
The index is in a primary up-trend.
Long-term: There are already two bull signals: the March 17 follow through day and the April 3 NYSE Bullish % signal. Wait for confirmation from a Dow/S&P primary trend reversal.
Treasury Secretaries who have come from an industry background tend to favor a weak dollar; to stimulate exports. Those who come from Wall Street favor a strong dollar; to protect the stock and bond markets. (more)
Hewlett-Packard, who last year merged with Compaq, reported first quarter earnings of 29 cents a share; two cents above analysts estimates. The PC-maker is still cautious about the sales outlook, but far less so than in the last quarter. (more)
New York (18.09): Spot gold continues to climb; currently at $US 368.20.
On the five-year chart gold has respected the long-term upward trendline.
The intermediate trend has reversed downwards but on a weak signal. A false break is often followed by a rally; so traders need to stay alert.
The primary trend is down. A rise above 3062 will signal an up-trend.
MACD (26,12,9) is below its signal line; Slow Stochastic (20,3,3) is below; Twiggs Money Flow (21) is weakening.
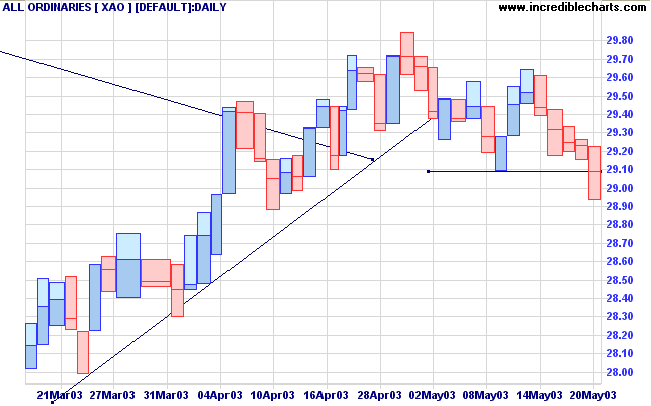
Intermediate: Long if the primary trend reverses up (XAO above 3062); short if the XAO is below 2909.
Long-term: There is already a bull signal: the March 18 follow through. Wait for confirmation from a primary trend reversal.
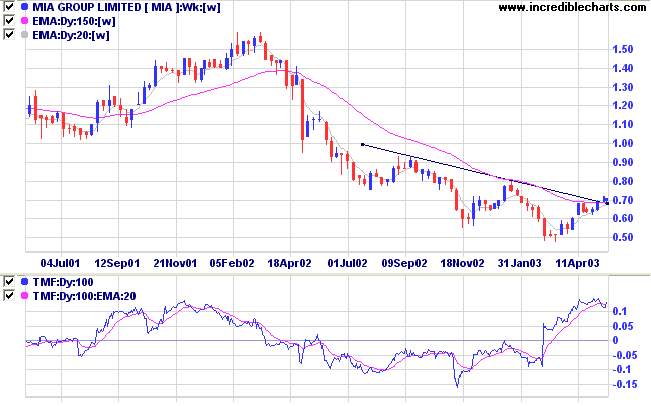
Last mentioned on April 29, 2003.
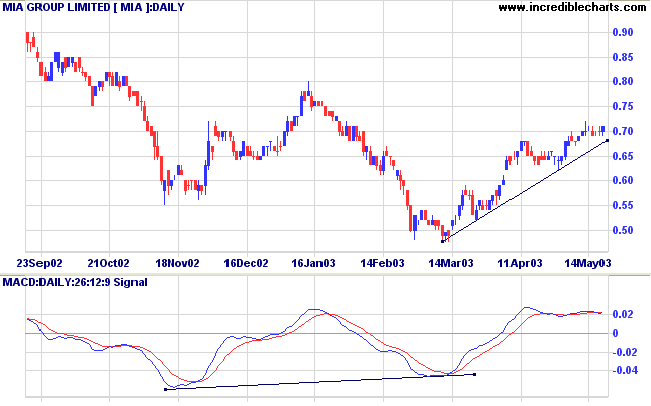
It is too early to say that MIA has formed a reversal, but it has broken above its downward trendline and long-term moving average; and Twiggs Money Flow (100-day) has kicked up sharply, reflecting strong accumulation.
The first rally off a new low is only suitable for aggressive short-term traders who are prepared to get out at the first sign of trouble -- such as a trendline break.
The false break at [4] failed to close below the previous low and is followed by a fast rally to [5].
Price has encountered resistance at 0.72, the high of [1].
There is also further overhead resistance at 0.80.
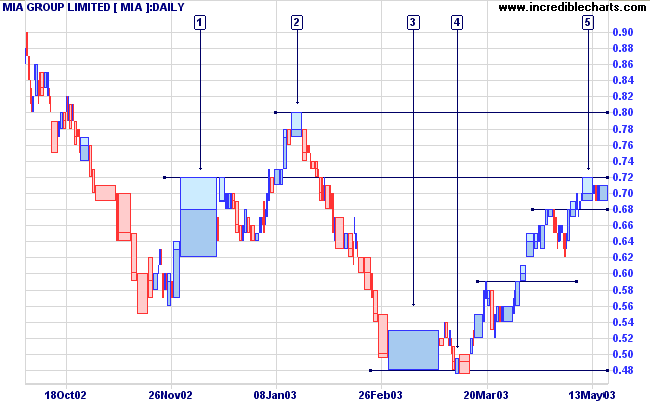
But a break above 0.72 on strong volume may prove me wrong.
The art of making your dream a reality
is simply remaining committed long enough
for reality to catch up to your dream.
- R Fleming.
Click here to access the Trading Diary Archives.
Back Issues

Author: Colin Twiggs is a former investment banker with almost 40 years of experience in financial markets. He co-founded Incredible Charts and writes the popular Trading Diary and Patient Investor newsletters.
Using a top-down approach, Colin identifies key macro trends in the global economy before evaluating selected opportunities using a combination of fundamental and technical analysis.
Focusing on interest rates and financial market liquidity as primary drivers of the economic cycle, he warned of the 2008/2009 and 2020 bear markets well ahead of actual events.
He founded PVT Capital (AFSL No. 546090) in May 2023, which offers investment strategy and advice to wholesale clients.