We are considering changing the Trading
Diary format. Please assist us by replying to this email
and completing the questions below. Highlight selected
answers in red
or with an asterisk*.
Your feedback will help us to identify areas that need attention.
Thanks |
Trading Diary
February 10, 2004
USA
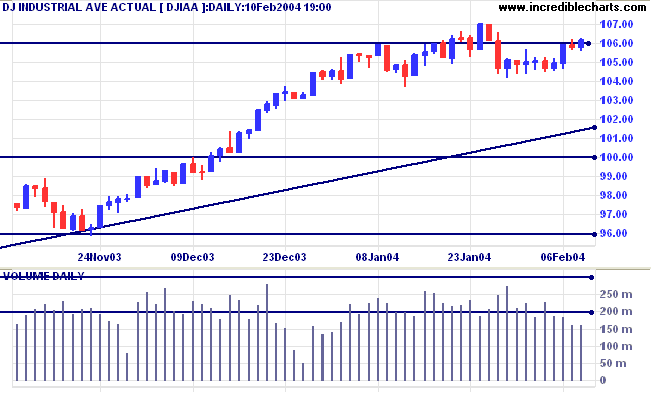
The intermediate trend is uncertain. A fall below 10417 will indicate the start of a down-trend.
The primary trend is up. A fall below support at 9600 will signal reversal.
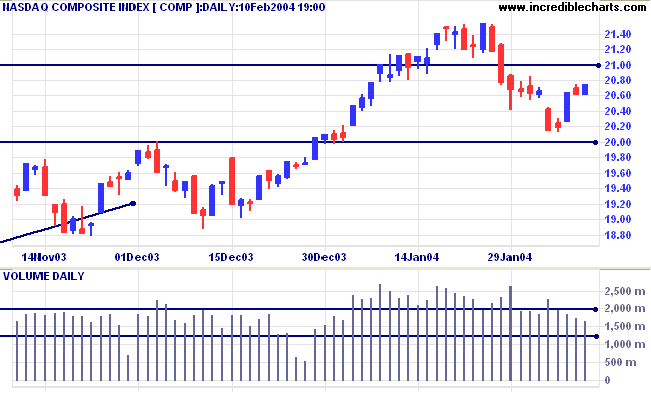
The intermediate trend is down. Support is at 2000.
The primary trend is up. A fall below support at 1640 will signal reversal.
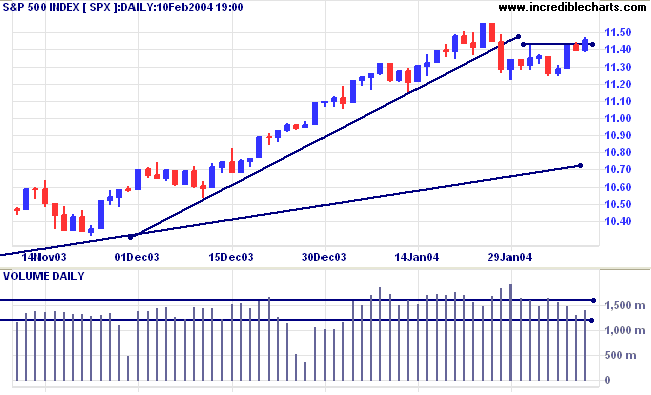
The intermediate trend is uncertain. Resistance is at 1155 and 1175 (from 2002). A fall below 1115 would signal the start of a down-trend.
Short-term: Bullish if the S&P500 is above 1155. Bearish below 1115.
Intermediate: Bullish above 1155.
Long-term: Bullish above 1000.
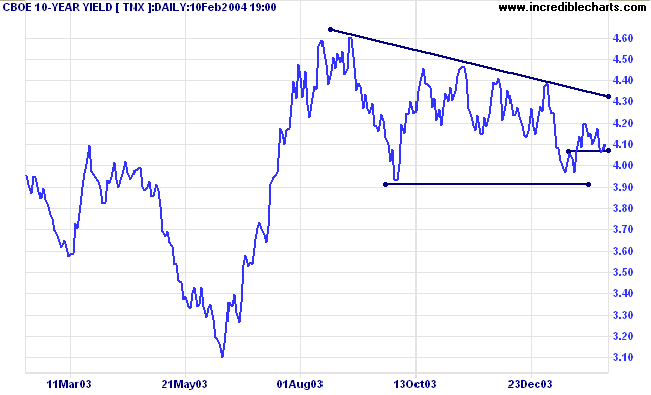
The yield on 10-year treasury notes rallied to 4.10%.
The intermediate trend is down.
The primary trend is up. A close below 3.93%, the support level in a large descending triangle, will signal the start of a down-trend.
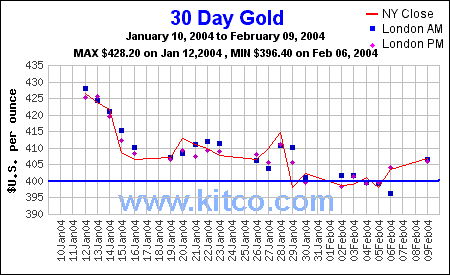
New York (21.28): Spot gold eased slightly to $406.70 after reaching 410 earlier in the day.
The intermediate trend is down.
The primary trend is up.
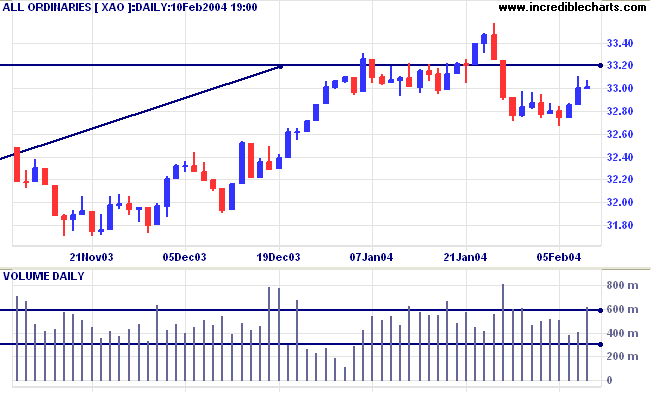
The primary trend is up. A fall below 3160 (the October 1 low) would signal reversal.
Intermediate term: Bullish above 3350. Bearish below 3160.
Long-term: Bearish below 3160.
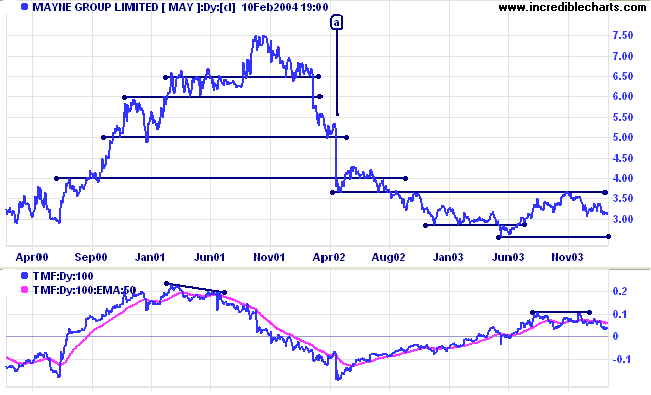
MAY illustrates why you should not enter directly after a cathartic sell-off, assuming it to be an absolute bottom. Price gapped down sharply at [a] on large volume. After a short rally, MAY re-tested support at the low of [a] before falling to a new low and commencing a further down-trend. Twiggs Money Flow had given early warning of the October 2001 top, with a bearish divergence in June 2001. Again, at [a], the indicator started to rise well ahead of the eventual bottom. These signals may be premature, but alert us to fundamental changes in buyer and seller behavior.
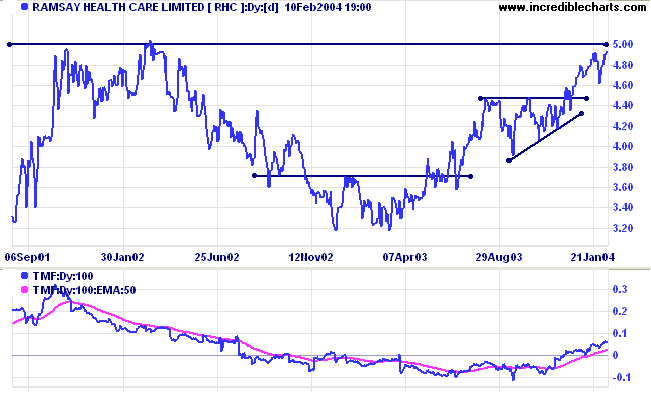
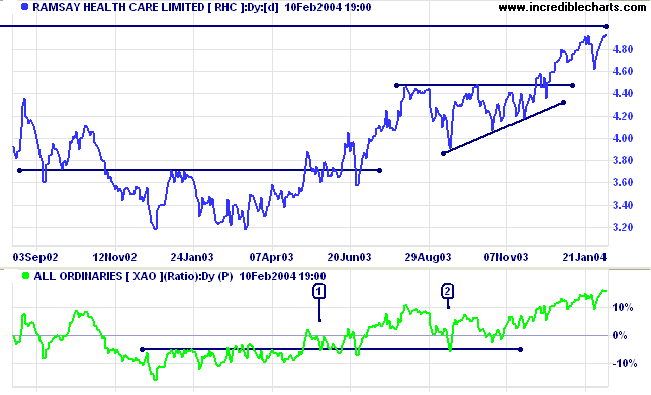
RHC is approaching major resistance at 5.00. Not a good time to enter unless there is a tight consolidation pattern, signaling accumulation, below the resistance level. Twiggs Money Flow started to rise after completion of an ascending triangle on the price chart. In this case the signal appears to be late.
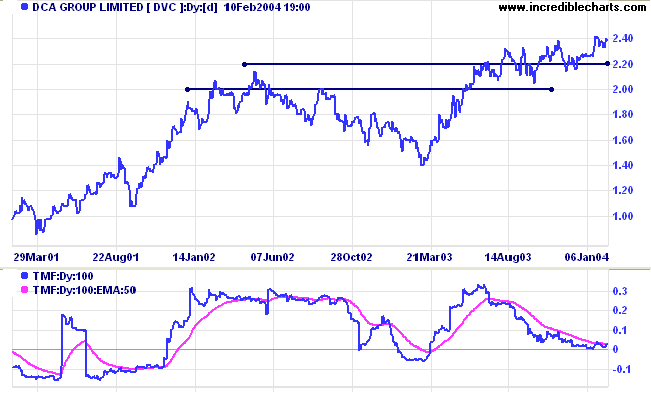
DVC has broken to new highs above 2.20 but so far has been creeping upwards, rather than establishing a strong trend. As mentioned before, creeping trends can resolve into a fast up- or down-trend and need to be watched carefully. Twiggs Money Flow appears to be leveling out after a bearish divergence.
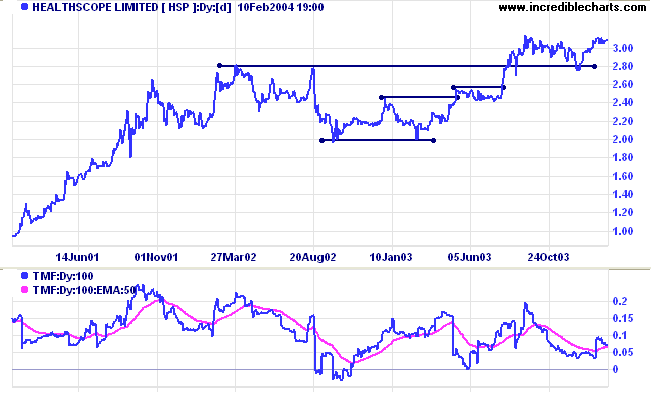
HSP displayed a lengthy mid-point consolidation between 2.80 and 2.00 before rallying to new highs. Similar to DVC above, price has not made much progress since the breakout. But consolidation above a new support level (in an up-trend) is a bullish sign. Twiggs Money Flow shows a few sharp sell-offs in the last two years but has managed to maintain above zero.
~ William Ralph Inge.
| If you use Windows 2000, please check that you have at least Service Pack 4 or later. There are SSL connection problems with earlier versions. Further information (and the latest update) is available at Microsoft Support. |
You can now view back issues at the Daily Trading Diary Archives.
Back Issues

Author: Colin Twiggs is a former investment banker with almost 40 years of experience in financial markets. He co-founded Incredible Charts and writes the popular Trading Diary and Patient Investor newsletters.
Using a top-down approach, Colin identifies key macro trends in the global economy before evaluating selected opportunities using a combination of fundamental and technical analysis.
Focusing on interest rates and financial market liquidity as primary drivers of the economic cycle, he warned of the 2008/2009 and 2020 bear markets well ahead of actual events.
He founded PVT Capital (AFSL No. 546090) in May 2023, which offers investment strategy and advice to wholesale clients.