Incredible Charts version 4.0.3.0
|
The latest update is now available. This
includes several improvements to the charting application
to help minimize communication errors. The download also
includes a new version of LiveUpdate.exe to streamline
the live update process. See
What's New for further details. Incredible Charts should update automatically to the new version (check under Help >> About). If this fails, please download and install the latest update over your existing version. |
Trading Diary
February 9, 2004
These extracts from my daily trading diary are
for educational purposes and should not be interpreted as
investment advice. Full terms and conditions can be found at
Terms
of Use .
USA
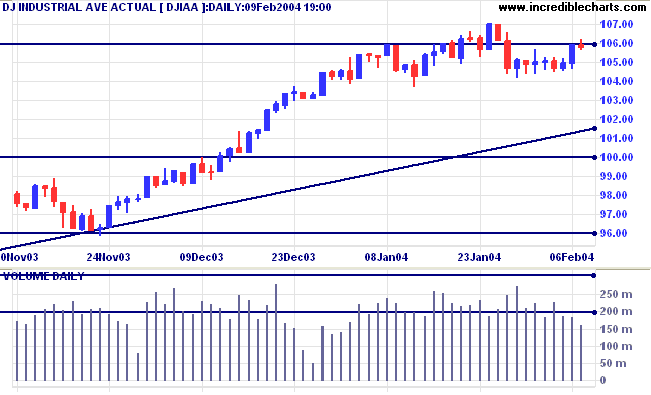
The Dow Industrial Average showed hesitancy,
with the index trading in a narrow range before closing slightly
lower at 10579 on low volume.
The intermediate trend is uncertain. A fall below 10417 (Jan. 29 low) would signal the start of a down-trend.
The primary trend is up. A fall below support at 9600 would signal reversal.
The intermediate trend is uncertain. A fall below 10417 (Jan. 29 low) would signal the start of a down-trend.
The primary trend is up. A fall below support at 9600 would signal reversal.
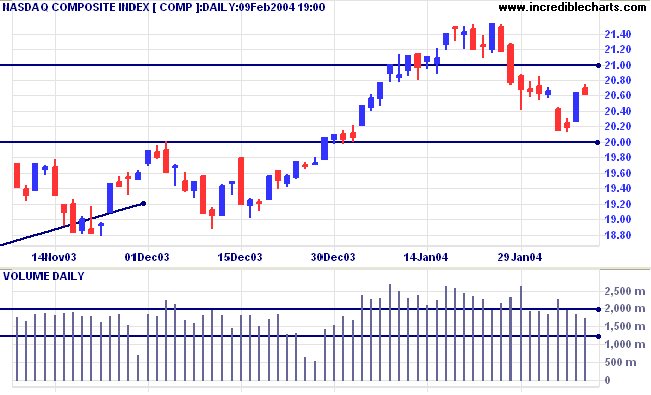
The Nasdaq Composite also rejected higher
prices, retreating to 2060 on lower volume.
The intermediate trend is down.
The primary trend is up. A fall below support at 1640 will signal reversal.
The intermediate trend is down.
The primary trend is up. A fall below support at 1640 will signal reversal.
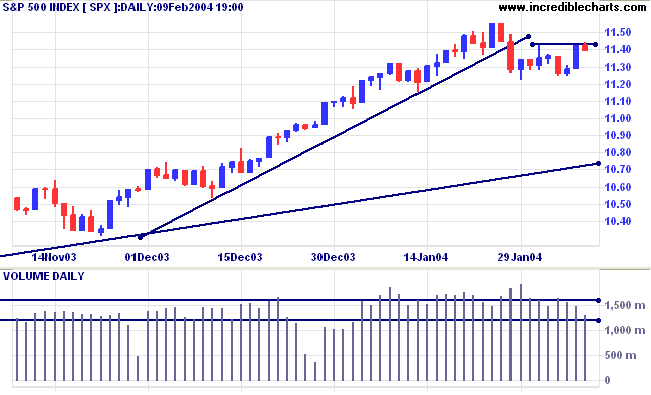
The S&P 500 tells a similar story: trading
in a narrow range before closing 3 points lower at 1139 on lower
volume. Buyers lack commitment.
The intermediate trend is uncertain. Resistance is at 1155 and 1175. A fall below 1122 (Jan 29 low) would signal the start of a down-trend.
Short-term: Bullish if the S&P500 is above the high of 1155. Bearish below 1122.
The intermediate trend is uncertain. Resistance is at 1155 and 1175. A fall below 1122 (Jan 29 low) would signal the start of a down-trend.
Short-term: Bullish if the S&P500 is above the high of 1155. Bearish below 1122.
The primary trend is up. A fall below 960 would
signal reversal.
Intermediate: Bullish above 1155.
Long-term: Bullish above 1000.
Intermediate: Bullish above 1155.
Long-term: Bullish above 1000.
The Chartcraft NYSE Bullish % Indicator rallied
to 84.89%.
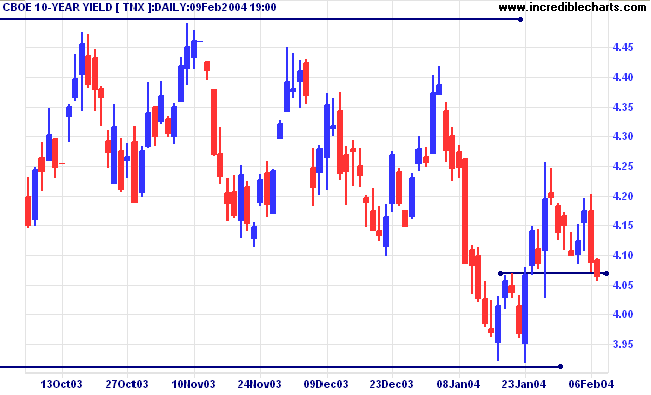
Treasury yields
The yield on 10-year treasury notes continued to fall, closing at 4.065%.
The intermediate trend has reversed down.
The primary trend is up. A close below 3.93% will signal reversal.
The yield on 10-year treasury notes continued to fall, closing at 4.065%.
The intermediate trend has reversed down.
The primary trend is up. A close below 3.93% will signal reversal.
Gold
New York (23.33): Spot gold is up at $407.51.
The intermediate trend is down. Support is at 400.
The primary trend is up.
New York (23.33): Spot gold is up at $407.51.
The intermediate trend is down. Support is at 400.
The primary trend is up.
ASX Australia
The All Ordinaries rallied to 3300. The weak close signals
selling pressure.
The intermediate trend is uncertain. A follow-through above 3300 will be a positive sign. A fall below the low of 3266 would signal the start of a down-trend.
Short-term: Bullish above 3350. Bearish below 3266.
The intermediate trend is uncertain. A follow-through above 3300 will be a positive sign. A fall below the low of 3266 would signal the start of a down-trend.
Short-term: Bullish above 3350. Bearish below 3266.
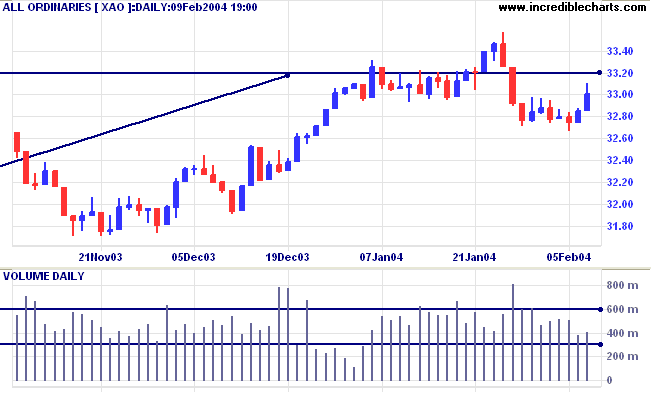
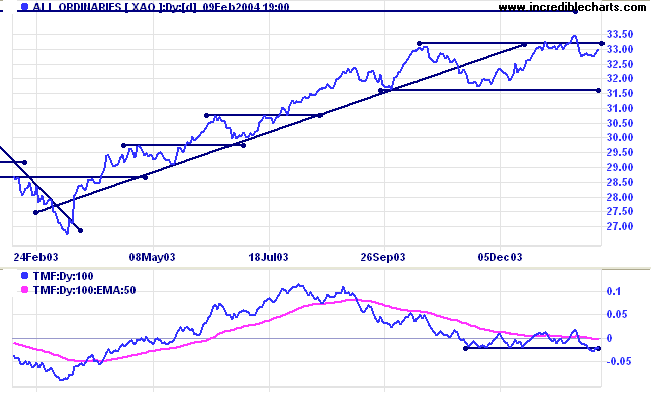
Twiggs Money Flow (100) is below its 3-month support level, but
appears to be recovering.
The primary trend is up. A fall below 3160 (the October 1 low) would signal reversal.
Intermediate term: Bullish above 3350. Bearish below 3160.
Long-term: Bearish below 3160.
The primary trend is up. A fall below 3160 (the October 1 low) would signal reversal.
Intermediate term: Bullish above 3350. Bearish below 3160.
Long-term: Bearish below 3160.
Health Care: Equipment
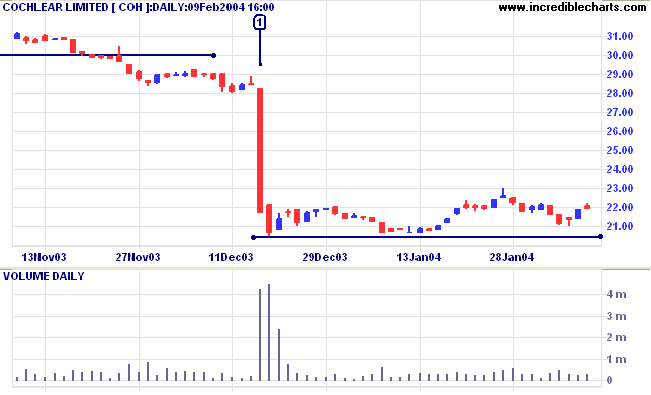
Cochlear [COH] was last covered on December 11, 2003.
The stock underwent a cathartic sell-off at [1], which may well establish the bottom of the stage 4 down-trend.
The stock underwent a cathartic sell-off at [1], which may well establish the bottom of the stage 4 down-trend.
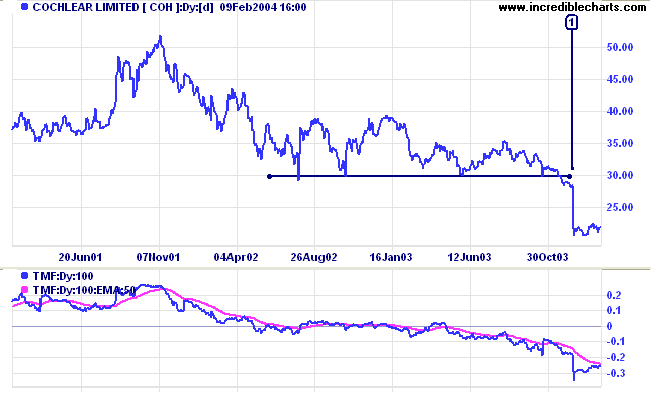
The sell-off must have shaken out many stock-holders who had
bought at higher prices and were holding on in the hope of a
recovery. The large volume tends to confirm this. New
stock-holders, who bought at lower prices, are likely to have a
more positive outlook. The stock does not yet present a trading
opportunity: it may consolidate in a stage 1 base for many months
before staging a rally.
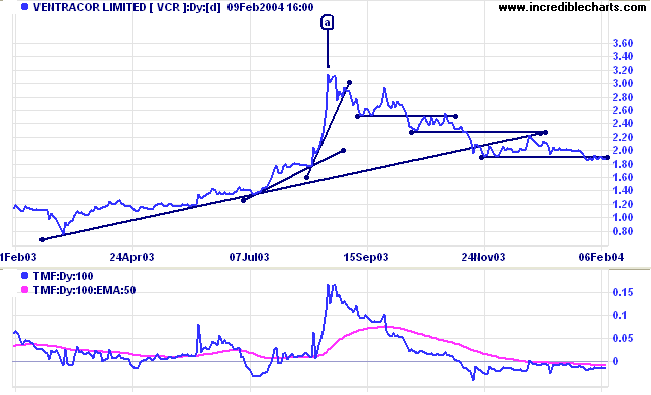
Ventracor [VCR] - last covered on November 17, 2003.
VCR experienced the opposite to COH: a blow-off spike at [a]. Rather than consolidate at the peak (as COH did at the low), blow-offs tend to reverse sharply back to previous support levels. The down-trend in this case has slowed after breaking below the long-term trendline; opposite to what I had expected. A creeping down-trend such as this can either rally or fall sharply; so it would not be a good idea to get in too early.
VCR experienced the opposite to COH: a blow-off spike at [a]. Rather than consolidate at the peak (as COH did at the low), blow-offs tend to reverse sharply back to previous support levels. The down-trend in this case has slowed after breaking below the long-term trendline; opposite to what I had expected. A creeping down-trend such as this can either rally or fall sharply; so it would not be a good idea to get in too early.
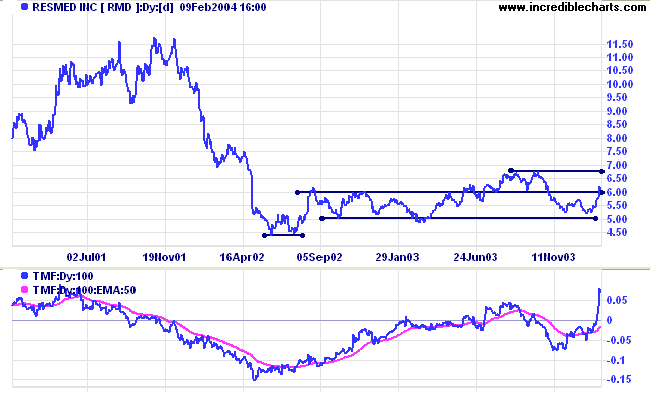
Resmed [RMD] - last covered on October 28, 2003.
RMD has been in a broad base since 2002. The first breakout failed, after a bearish divergence on Twiggs Money Flow. The indicator (TMF) has since turned up sharply to signal strong accumulation. Price also responded with a rise above the 6.00 resistance level.
RMD has been in a broad base since 2002. The first breakout failed, after a bearish divergence on Twiggs Money Flow. The indicator (TMF) has since turned up sharply to signal strong accumulation. Price also responded with a rise above the 6.00 resistance level.
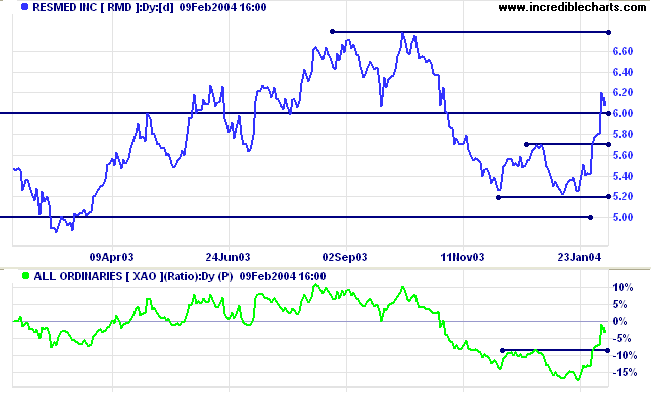
Relative Strength (price ratio: xao) has rallied above the
previous peak. A pull-back that respects the new support level
(on price and RS charts) would be a healthy bull signal.
The recent (December - January) double bottom pattern has reached
its target of 6.20: 5.70 + (5.70 - 5.20).
Price formed a breakaway gap above the 6.00 level. Volume is drying up on the pull-back. A rise above 6.20, without filling the recent gap, would be a further bullish sign.
Price formed a breakaway gap above the 6.00 level. Volume is drying up on the pull-back. A rise above 6.20, without filling the recent gap, would be a further bullish sign.
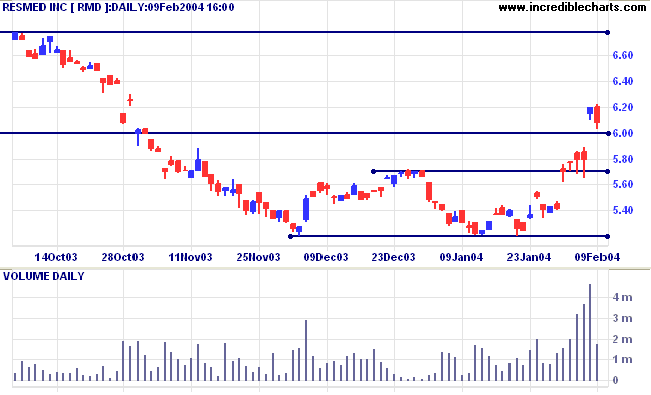
A fall below 5.20 would be a bear signal.
About
the Trading Diary has been expanded to offer further
assistance to readers, including directions on how to search the
archives.
Colin Twiggs
Perfection is achieved, not when there is nothing more to
add,
but when there is nothing left to take away.
~ Antoine de Saint-Exupery.
but when there is nothing left to take away.
~ Antoine de Saint-Exupery.
Windows 2000
| If you use Windows 2000, please check that you have at least Service Pack 4 or later. There are SSL connection problems with earlier versions. Further information (and the latest update) is available at Microsoft Support. |
Back Issues
You can now view back issues at the Daily Trading Diary Archives.
You can now view back issues at the Daily Trading Diary Archives.
Back Issues
Access the Trading Diary Archives.

Author: Colin Twiggs is a former investment banker with almost 40 years of experience in financial markets. He co-founded Incredible Charts and writes the popular Trading Diary and Patient Investor newsletters.
Using a top-down approach, Colin identifies key macro trends in the global economy before evaluating selected opportunities using a combination of fundamental and technical analysis.
Focusing on interest rates and financial market liquidity as primary drivers of the economic cycle, he warned of the 2008/2009 and 2020 bear markets well ahead of actual events.
He founded PVT Capital (AFSL No. 546090) in May 2023, which offers investment strategy and advice to wholesale clients.