Stock Screens: USA
US stocks and indexes are being added to the stock screen module
and should be available by next week.
US stocks and indexes are being added to the stock screen module
and should be available by next week.
Trading Diary
December 11, 2003
These extracts from my daily trading diary are
for educational purposes and should not be interpreted as
investment advice. Full terms and conditions can be found at
Terms
of Use .
USA
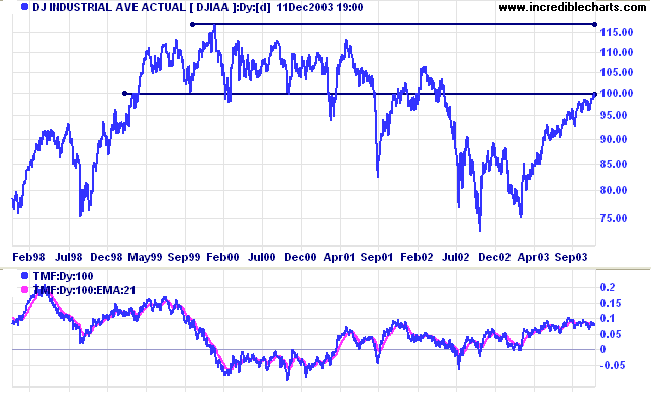
The Dow Industrial Average closed at 10008,
above the key 10000 resistance level. Low volume raises doubt
over whether the index can hold above this level.
The intermediate trend has turned up. If the index is able to hold, with the pull-back respecting the new support level, this will be a strong bull signal.
The primary trend is up. A fall below support at 9000 will signal reversal.
The intermediate trend has turned up. If the index is able to hold, with the pull-back respecting the new support level, this will be a strong bull signal.
The primary trend is up. A fall below support at 9000 will signal reversal.
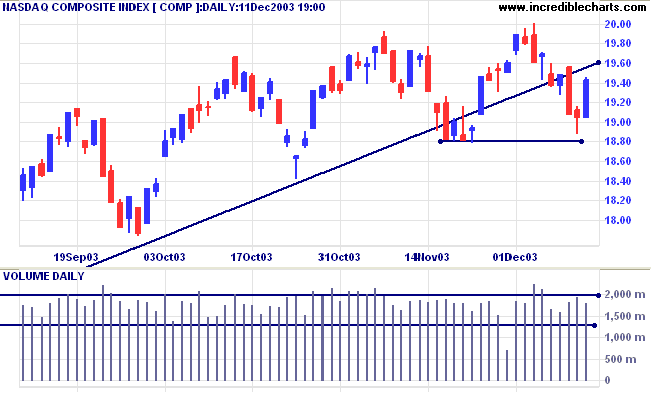
The Nasdaq Composite rallied strongly to close
38 points up at 1942 on lower volume.
The intermediate trend is uncertain. Expect support at 1880 and 1840, with resistance at 2000. A fall below 1880 would complete a double top reversal, with a target of 1760: 1880-(2000-1880).
The primary trend is up. A fall below support at 1640 will signal reversal.
The intermediate trend is uncertain. Expect support at 1880 and 1840, with resistance at 2000. A fall below 1880 would complete a double top reversal, with a target of 1760: 1880-(2000-1880).
The primary trend is up. A fall below support at 1640 will signal reversal.
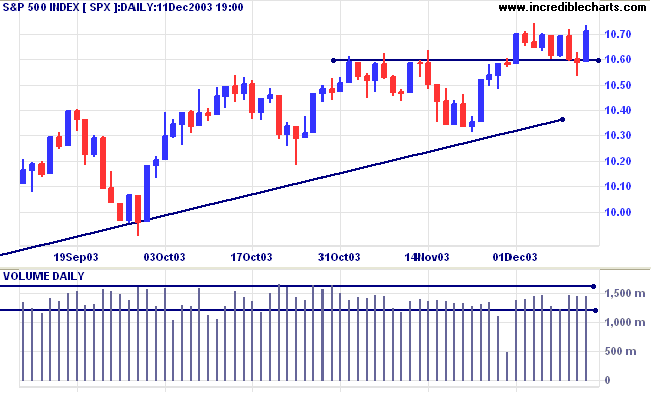
The S&P 500 rallied to close at 1071 on
average volume. The break above the recent consolidation is
a bullish signal.
The intermediate trend has turned up.
Short-term: Bullish if the S&P500 is above the high of 1070. Bearish below 1059 (Thursday's low).
The intermediate trend has turned up.
Short-term: Bullish if the S&P500 is above the high of 1070. Bearish below 1059 (Thursday's low).
The primary trend is up. A fall below 960 will
signal reversal.
Intermediate: Bullish above 1070.
Long-term: Bullish above 960.
Intermediate: Bullish above 1070.
Long-term: Bullish above 960.
The Chartcraft NYSE Bullish % Indicator increased
to 81.49% (December 11).
Treasury yields
The yield on 10-year treasury notes closed down at 4.23%.
The intermediate trend is down.
The primary trend is up.
The yield on 10-year treasury notes closed down at 4.23%.
The intermediate trend is down.
The primary trend is up.
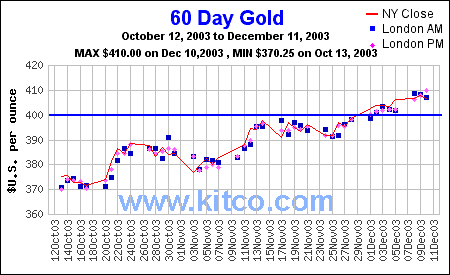
Gold
New York (20.41): Spot gold eased to $405.20.
The intermediate trend is up.
The primary trend is up. Expect support at 400, resistance at 415.
New York (20.41): Spot gold eased to $405.20.
The intermediate trend is up.
The primary trend is up. Expect support at 400, resistance at 415.
ASX Australia
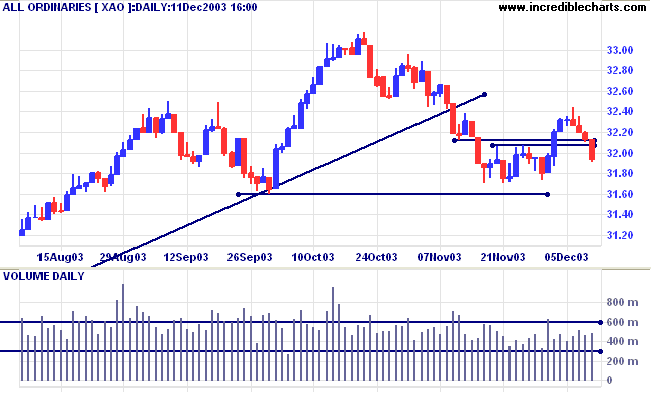
The All Ordinaries broke through the initial
3212 support level, closing 19 points lower at 3193 on higher
volume.
The intermediate up-trend is weakening.
The intermediate up-trend is weakening.
MACD (26,12,9) is above its signal line; Slow
Stochastic (20,3,3) is below.
Short-term: Bullish above 3212, today's high. Bearish below 3173 (December 1st low).
Short-term: Bullish above 3212, today's high. Bearish below 3173 (December 1st low).
XAO is below the long-term trendline, signaling
weakness. The primary trend is up but will reverse if there is a
fall below 3160 (the October 1 low). Twiggs Money Flow (100) is
below its signal line, following a large bearish triple
divergence.
Intermediate term: Bullish above 3212. Bearish below 3160.
Long-term: Bearish below 3160.
Intermediate term: Bullish above 3212. Bearish below 3160.
Long-term: Bearish below 3160.
Wattyl [WYL]
Last covered on November 24, 2003.
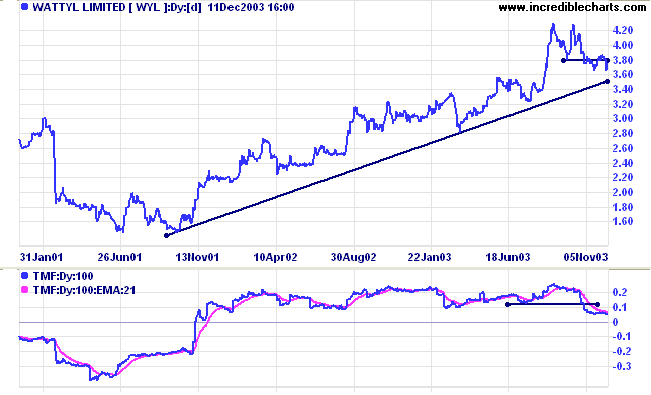
Wattyl has been in a stage 2 up-trend for over 2 years. Recently the stock completed a double top reversal after a fast intermediate up-trend.
Twiggs Money Flow (100) is declining after crossing below its signal line.
Last covered on November 24, 2003.
Wattyl has been in a stage 2 up-trend for over 2 years. Recently the stock completed a double top reversal after a fast intermediate up-trend.
Twiggs Money Flow (100) is declining after crossing below its signal line.
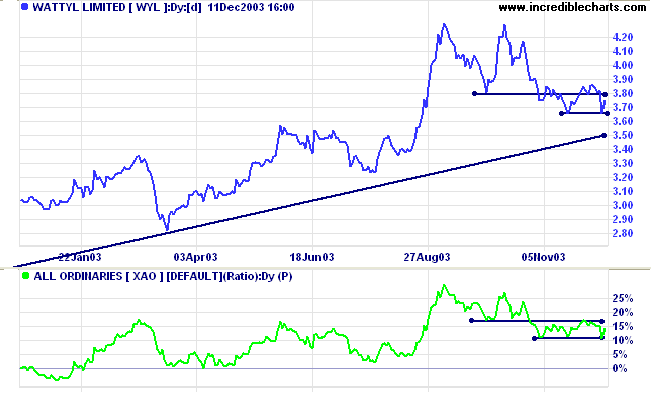
Relative Strength (xao) fell after the double
top and is now consolidating below the previous support level; a
bearish sign.
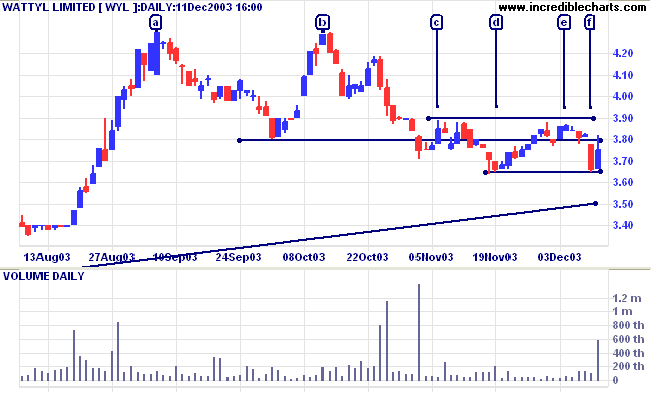
The double top pattern at [a] and [b] was
completed by a fall, on strong volume, below the 3.80 support
level in early November. The target is 3.30: 3.80-(4.30 -
3.80).
Price then retreated back above the support level and has since consolidated in a narrow range around 3.80; a bearish sign unless the latest pull-back breaks above 3.90. Volume dried up during the consolidation but has picked up today, so we cannot completely write off an upward breakout.
Price then retreated back above the support level and has since consolidated in a narrow range around 3.80; a bearish sign unless the latest pull-back breaks above 3.90. Volume dried up during the consolidation but has picked up today, so we cannot completely write off an upward breakout.
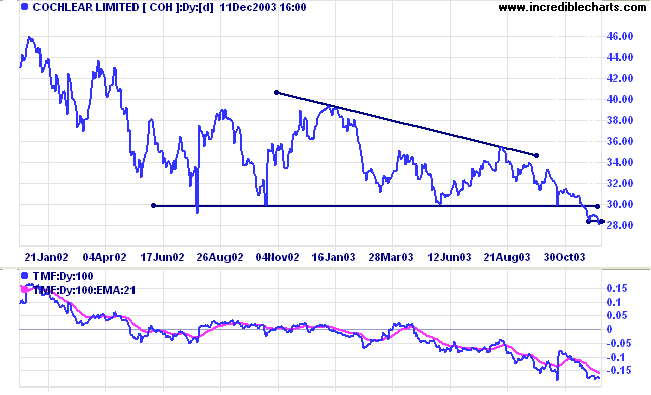
Cochlear [COH]
Last covered November 27, 2003.
Need I say more? The chart says it all.
COH has broken below support from a huge descending triangle, while Twiggs Money Flow has been falling for the last 6 months, signaling strong distribution.
Last covered November 27, 2003.
Need I say more? The chart says it all.
COH has broken below support from a huge descending triangle, while Twiggs Money Flow has been falling for the last 6 months, signaling strong distribution.
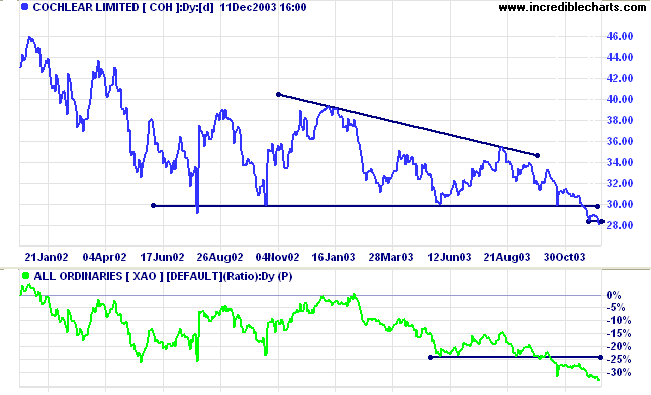
Relative Strength (xao) has fallen below the RS
support level, with a recent peak failing to reach the former
support level, a strong bear signal.
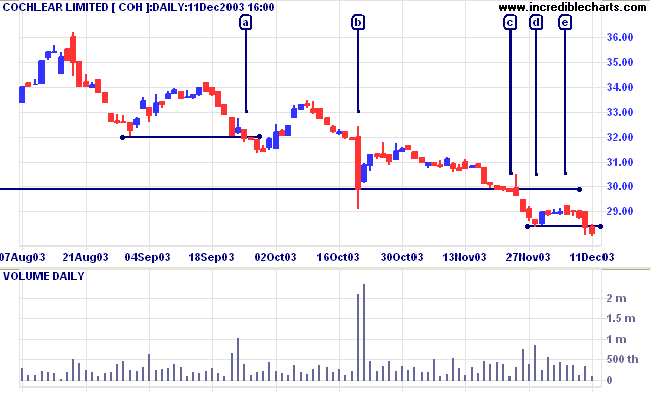
The primary trend reversed down at [a], with a
fall below the previous low after a lower high. This was followed
by a cathartic sell-off on huge volume which halted at the 30.00
support level. The attempted rally lacked volume and ended with a
correction below support at [c]. Price has now broken below the
low of [d]; after the pull-back at [e] failed to reach the new
30.00 resistance level, signaling a fast down-trend.
.
.
Understanding
the Trading Diary has been expanded to offer further
assistance to readers, including directions on how to search the
archives.
Colin Twiggs
Beyond a wholesome discipline,
be gentle with yourself.
~ Max Ehrmann: Desiderata (1927)
be gentle with yourself.
~ Max Ehrmann: Desiderata (1927)
Dilution
Adjustments
Where price history is adjusted for the effect of corporate actions.
Where price history is adjusted for the effect of corporate actions.
Back Issues
You can now view back issues at the Daily Trading Diary Archives.
You can now view back issues at the Daily Trading Diary Archives.
Back Issues
Access the Trading Diary Archives.

Author: Colin Twiggs is a former investment banker with almost 40 years of experience in financial markets. He co-founded Incredible Charts and writes the popular Trading Diary and Patient Investor newsletters.
Using a top-down approach, Colin identifies key macro trends in the global economy before evaluating selected opportunities using a combination of fundamental and technical analysis.
Focusing on interest rates and financial market liquidity as primary drivers of the economic cycle, he warned of the 2008/2009 and 2020 bear markets well ahead of actual events.
He founded PVT Capital (AFSL No. 546090) in May 2023, which offers investment strategy and advice to wholesale clients.