|
World Clock Here is a world clock that I find useful for coordinating time zones: timeanddate.com/world clock You can add or remove cities using the Setup button. |
Trading Diary
October 28, 2003
These extracts from my daily trading diary
are for educational purposes
and should not be interpreted as investment
advice. Full terms and conditions can be found at Terms
of Use .
USA
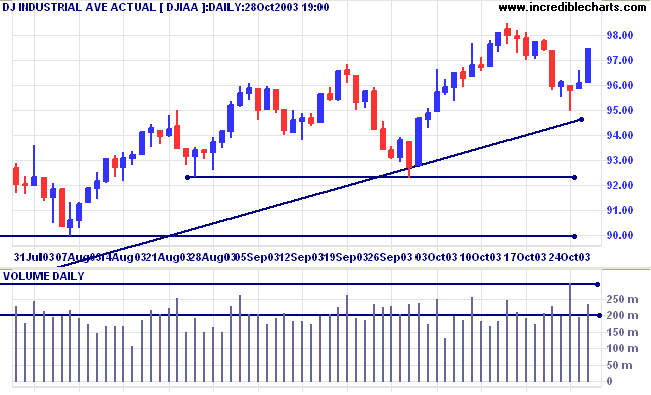
Encouraged by Fed hints that rates will be held low for some
time, the Dow Industrial Average rallied 1.5% to 9748 on higher
volume.
The intermediate down-trend has weakened.
The primary trend is up. A fall below 9000 will signal reversal.
The intermediate down-trend has weakened.
The primary trend is up. A fall below 9000 will signal reversal.
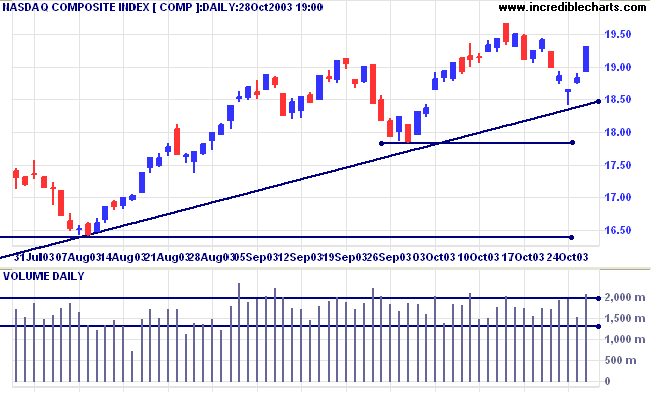
The Nasdaq Composite gained 49 points to close at 1932 on strong
volume.
The intermediate down-trend appears weak.
The primary trend is up. A fall below 1640 will signal reversal.
The intermediate down-trend appears weak.
The primary trend is up. A fall below 1640 will signal reversal.
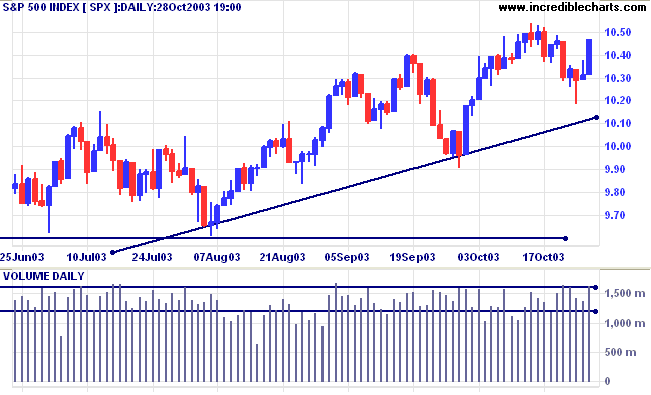
The S&P 500 jumped 16 points to close at 1047 on strong
volume.
The intermediate down-trend is weak.
The primary trend is up. A fall below 960 will signal reversal.
The intermediate down-trend is weak.
The primary trend is up. A fall below 960 will signal reversal.
The Chartcraft NYSE Bullish % Indicator improved
slightly to 80.65% (October 28).
Market Strategy
Short-term: Bullish if the S&P500 is above 1054. Bearish below 1026.
Intermediate: Bullish above 1054.
Long-term: Bullish above 960.
Short-term: Bullish if the S&P500 is above 1054. Bearish below 1026.
Intermediate: Bullish above 1054.
Long-term: Bullish above 960.
Fed steady at 1.0%
The Federal Reserve board agrees to hold the overnight bank lending rate at 1.0%, hinting that they will keep rates low for as long as possible. (more)
The Federal Reserve board agrees to hold the overnight bank lending rate at 1.0%, hinting that they will keep rates low for as long as possible. (more)
Confidence up
The Conference Board index of consumer confidence rose to 81.1 from 77 in September. (more)
The Conference Board index of consumer confidence rose to 81.1 from 77 in September. (more)
Treasury yields
The yield on 10-year treasury notes fell to 4.19%.
The intermediate trend is down.
The primary trend is up.
The yield on 10-year treasury notes fell to 4.19%.
The intermediate trend is down.
The primary trend is up.
Gold
New York (20.22): Spot gold fell to $381.90.
The intermediate trend is up.
The primary trend is up. Expect resistance at 400 to 415.
New York (20.22): Spot gold fell to $381.90.
The intermediate trend is up.
The primary trend is up. Expect resistance at 400 to 415.
ASX Australia
The All Ordinaries closed 1 points lower at 3254 on average
volume, holding above initial support at 3238 to 3250. Expect a
boost after the strong US performance.
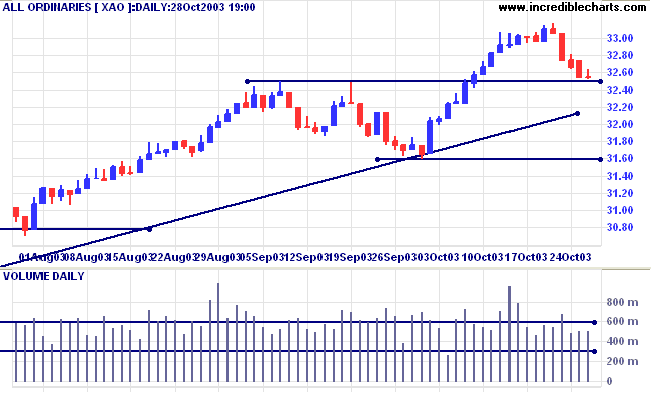
The intermediate up-trend is weak.
The primary trend is up. The rally is extended and the probability of a reversal increases with each successive primary trend movement.
A fall below 3160 will signal reversal.
MACD (26,12,9) is below its signal line; Slow Stochastic (20,3,3) is below; Twiggs Money Flow (100) is below its signal line and displays a bearish "triple" divergence.
Market Strategy
Short-term: Bullish if the All Ords is above 3317. Bearish below 3238.
Intermediate: Bullish above 3317.
Long-term: Bullish above 3160.
Short-term: Bullish if the All Ords is above 3317. Bearish below 3238.
Intermediate: Bullish above 3317.
Long-term: Bullish above 3160.
Resmed [RMD]
Last covered August 28, 2002. Resmed established a broad base between 5.00 and 6.00 before breaking out in July, after an earlier false break in June. Price has formed equal highs after testing support at 6.00, not a bear signal unless there is a break below the intervening trough. Twiggs Money Flow (100), however, has formed a bearish divergence.
Last covered August 28, 2002. Resmed established a broad base between 5.00 and 6.00 before breaking out in July, after an earlier false break in June. Price has formed equal highs after testing support at 6.00, not a bear signal unless there is a break below the intervening trough. Twiggs Money Flow (100), however, has formed a bearish divergence.
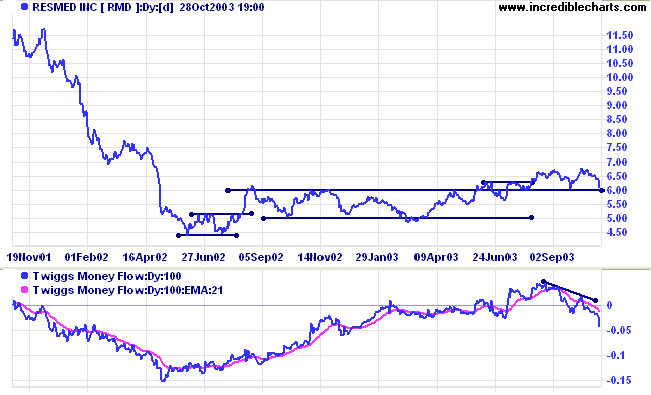
Relative Strength (xao) has fallen below the September low,
signaling weakness. Stops are in place just below 6.00.
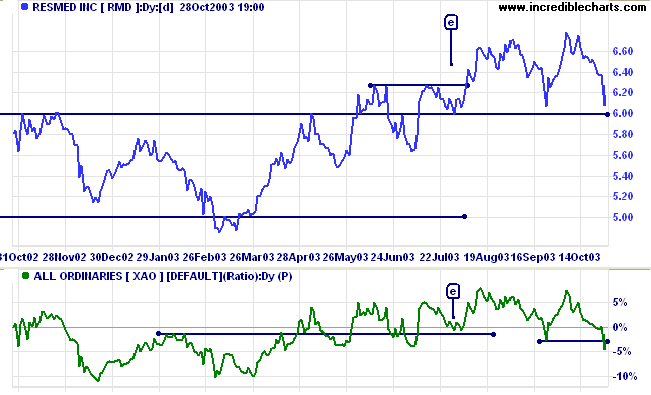
The earlier caption at [e] shows the entry point when price respected the 6.00 support level, confirmed by a similar pattern on RS.
The earlier caption at [e] shows the entry point when price respected the 6.00 support level, confirmed by a similar pattern on RS.
ERG Limited [ERG]
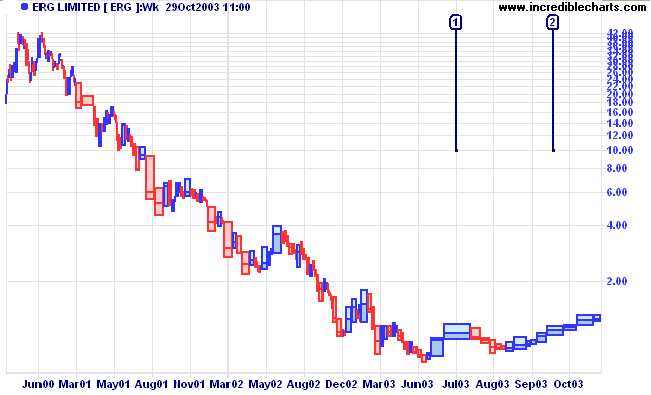
Last Covered September 1, 2003. Weekly equivolume best depicts the accumulation of ERG over the past 5 months, with far broader bars (signaling heavy volume) in the rallies at [1] and [2] than in the previous down-trend. I had to use a log scale because of the spectacular decline over the previous 3 years: from 42.00 to below 1.00.
Last Covered September 1, 2003. Weekly equivolume best depicts the accumulation of ERG over the past 5 months, with far broader bars (signaling heavy volume) in the rallies at [1] and [2] than in the previous down-trend. I had to use a log scale because of the spectacular decline over the previous 3 years: from 42.00 to below 1.00.
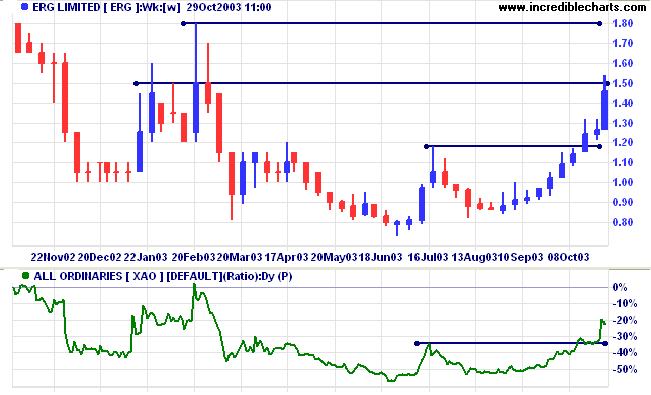
Twiggs Money Flow (100) and Relative Strength (xao) are rising.
Price is likely to encounter resistance between 1.50 and
1.80.
If Relative Strength respects its support level on the next pull-back, the stock should present entry opportunities.
If Relative Strength respects its support level on the next pull-back, the stock should present entry opportunities.
Understanding
the Trading Diary has been expanded to offer further
assistance to readers, including
directions on how to search the archives.
Colin Twiggs
At the age of 65, out of every 100 people:
1 will be rich;
4 will be comfortable;
1 will be rich;
4 will be comfortable;
5 will still be working;
56 will be on Government support;
34 will be dead.
~ please don't challenge me on these statistics, I got them off a pamphlet.
The moral of the story: focus on getting into the top 5
but don't forget the real priority is to stay out of the bottom 34.
56 will be on Government support;
34 will be dead.
~ please don't challenge me on these statistics, I got them off a pamphlet.
The moral of the story: focus on getting into the top 5
but don't forget the real priority is to stay out of the bottom 34.
Daylight Saving
Confused by daylight saving?
See Time Zones for details of how daylight saving adjustments affect you.
Confused by daylight saving?
See Time Zones for details of how daylight saving adjustments affect you.
Back Issues
You can now view back issues at the Daily Trading Diary Archives.
You can now view back issues at the Daily Trading Diary Archives.
Back Issues
Access the Trading Diary Archives.

Author: Colin Twiggs is a former investment banker with almost 40 years of experience in financial markets. He co-founded Incredible Charts and writes the popular Trading Diary and Patient Investor newsletters.
Using a top-down approach, Colin identifies key macro trends in the global economy before evaluating selected opportunities using a combination of fundamental and technical analysis.
Focusing on interest rates and financial market liquidity as primary drivers of the economic cycle, he warned of the 2008/2009 and 2020 bear markets well ahead of actual events.
He founded PVT Capital (AFSL No. 546090) in May 2023, which offers investment strategy and advice to wholesale clients.