|
The new subscription page has now been
posted at Subscribe. It offers the Premium Charting service and the Daily Trading Diary separately at $180 AUD each, or $270 for the combined service (as previously offered). Existing members who wish to amend their subscription to one of the new options should contact members support, with their ShopperID or Activation Key, before February 27th, 2004. |
Trading Diary
February 4, 2004
USA
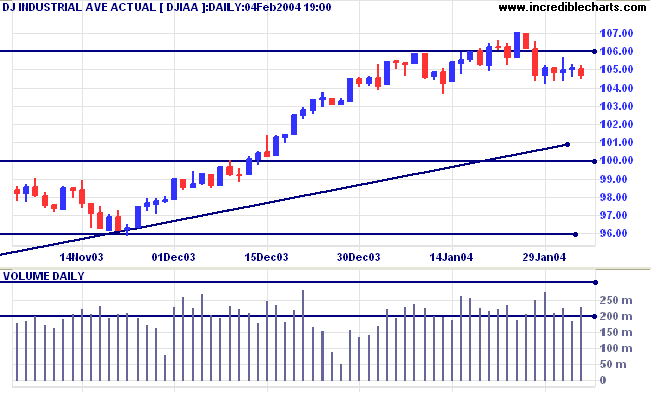
The intermediate trend is up. A fall below Thursday's low of 10417 would signal reversal to a down-trend.
The primary trend is up. A fall below support at 9600 would signal reversal.
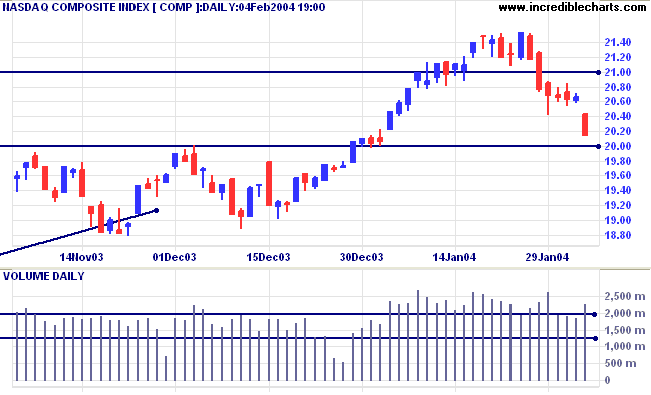
The intermediate trend has reversed downwards. Initial support is at 2000.
The primary trend is up. A fall below support at 1640 will signal reversal.
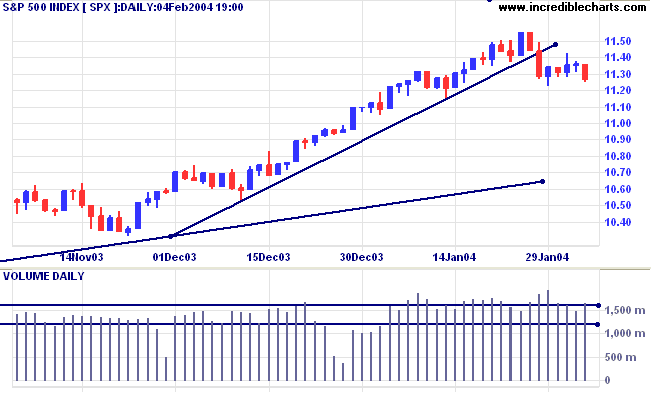
The intermediate trend is up. A fall below 1122 (Thursday's low) would signal reversal to a down-trend.
Short-term: Bullish if the S&P500 is above 1155. Bearish below 1122.
Intermediate: Bullish above 1155. Bearish below 960.
Long-term: Bullish above 1000. Bearish below 960.
The ISM non-manufacturing index jumped to 65.7, from 58 in December. (more)
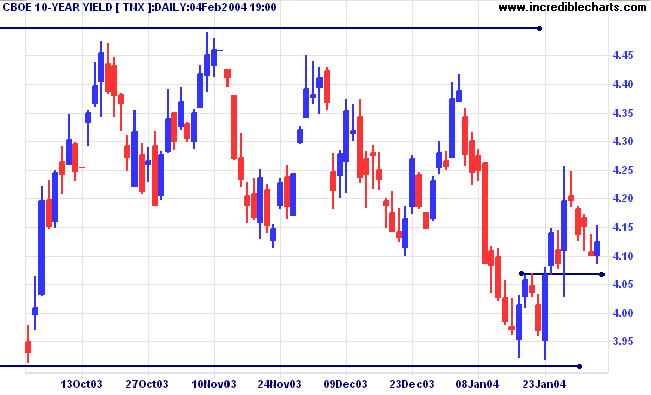
The yield on 10-year treasury notes rallied to close at 4.124%, above preliminary support at 4.07%.
The intermediate trend is up.
The primary trend is up. A close below 3.93% would signal reversal.
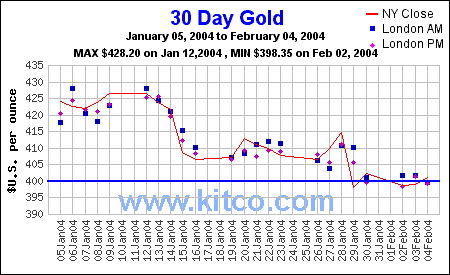
New York (22.15): Spot gold recovered to $400.50.
The intermediate trend is down. Support is at 400.
The primary trend is up.
A fall below 3271 would signal an intermediate down-trend, with a likely test of support at 3160.
Short-term: Bullish above 3350. Bearish below 3271 (Thursday's low).
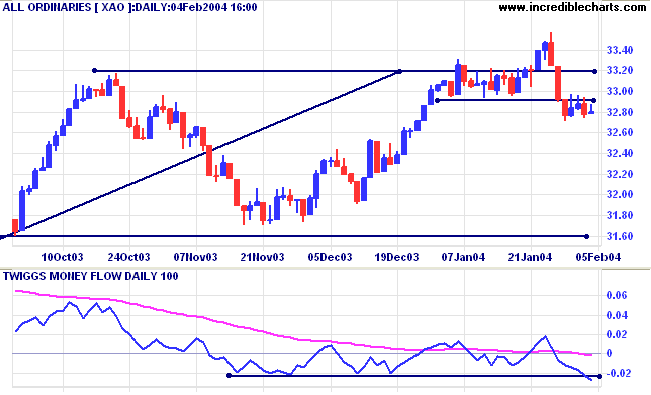
The primary trend is up. A fall below 3160 (the October 1 low) would signal reversal.
Intermediate term: Bullish above 3350. Bearish below 3160.
Long-term: Bearish below 3160.
Last covered on August 6, 2003.
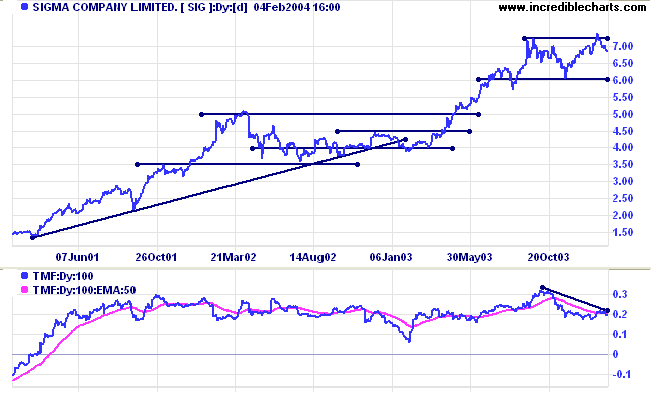
SIG has been in a strong stage 2 up-trend for the past 3 years. Twiggs Money Flow displays an awe-inspiring accumulation signal over the entire period, never once crossing below zero.
We now see bearish signs appearing, with a false break above the previous high on the price chart, and a bearish divergence on Twiggs Money Flow. These are just warning signs at this stage, but a break below 6.00 would add strong confirmation, especially if accompanied by a similar reversal on the Relative Strength chart.
Last covered September 11, 2003.
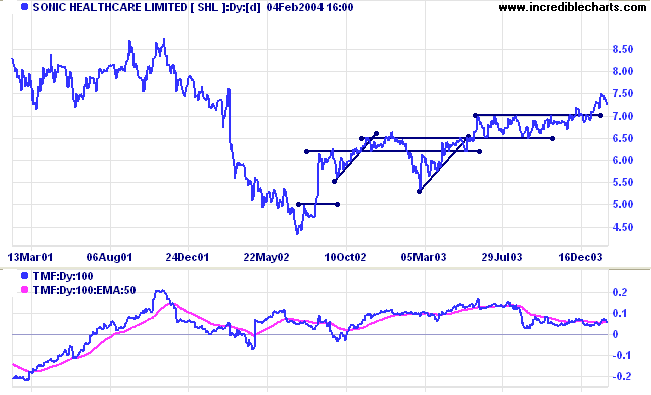
Another Health Care Distributor, SHL, is in a creeping up-trend after a lengthy consolidation between 6.50 and 7.00. Twiggs Money Flow signals accumulation. Creeping trends can either accelerate into a fast trend, with no overlap between troughs and previous peaks, or reverse into a down-trend; so they should be monitored closely.
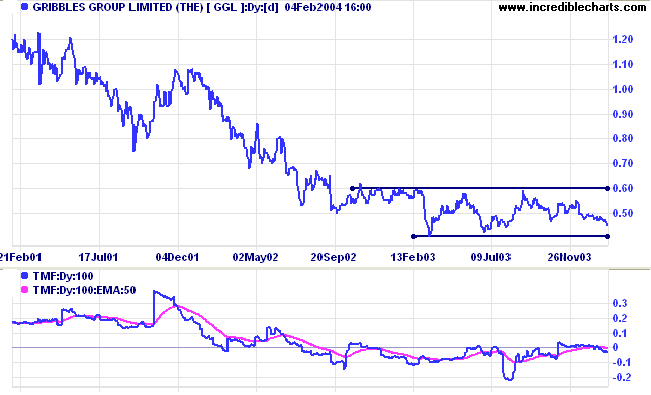
Last covered October 22, 2003. Gribbles is in a stage 1 base. Twiggs Money Flow continues to signal distribution.
Last covered September 11, 2003.
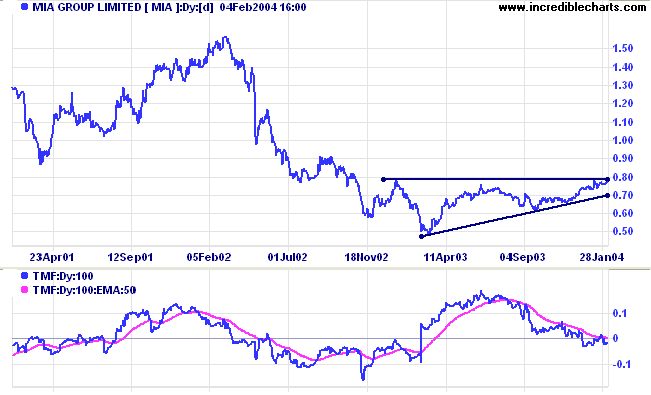
The last of the four ASX 200 Health Care Distributors, MIA has formed a stage 1 base in the shape of a bullish ascending triangle. Whilst Twiggs Money Flow may be falling, the stock should be monitored for accumulation signals. A break above resistance at 0.80 would be a bullish sign, especially if echoed on the Relative Strength chart.
The hard part is doing it.
~ Gen. H. Norman Schwarzkoff
Dow Jones Industrial Average and S&P
500 have been added to the list of Indexes.
If you screen US stocks you can now restrict your search to
components of either of these indexes.
You can now view back issues at the Daily Trading Diary Archives.
Back Issues

Author: Colin Twiggs is a former investment banker with almost 40 years of experience in financial markets. He co-founded Incredible Charts and writes the popular Trading Diary and Patient Investor newsletters.
Using a top-down approach, Colin identifies key macro trends in the global economy before evaluating selected opportunities using a combination of fundamental and technical analysis.
Focusing on interest rates and financial market liquidity as primary drivers of the economic cycle, he warned of the 2008/2009 and 2020 bear markets well ahead of actual events.
He founded PVT Capital (AFSL No. 546090) in May 2023, which offers investment strategy and advice to wholesale clients.
