| Some members have reported that earlier versions of Internet Explorer interfere with the Live Update. If you experience a timeout error during the Live Update, update to Internet Explorer 6 at Microsoft Download. |
Trading Diary
January 22, 2004
USA
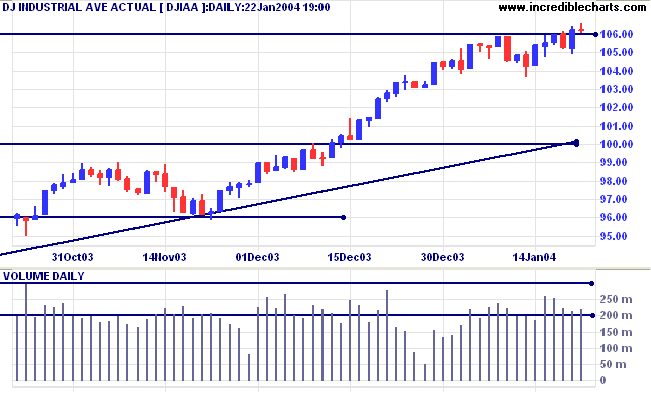
The intermediate trend is up.
The primary trend is up. A fall below support at 9600 will signal reversal.
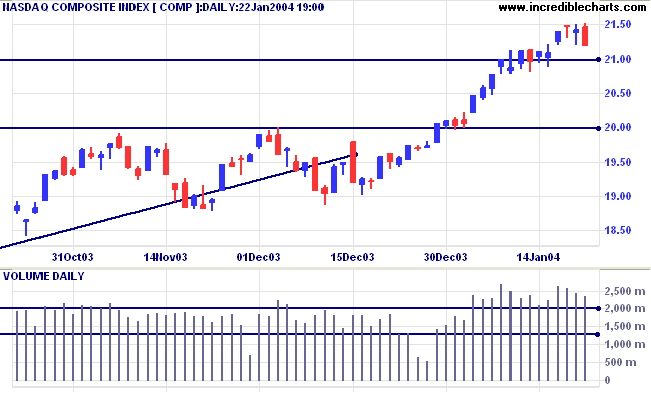
The intermediate trend is up.
The primary trend is up. A fall below support at 1640 will signal reversal.
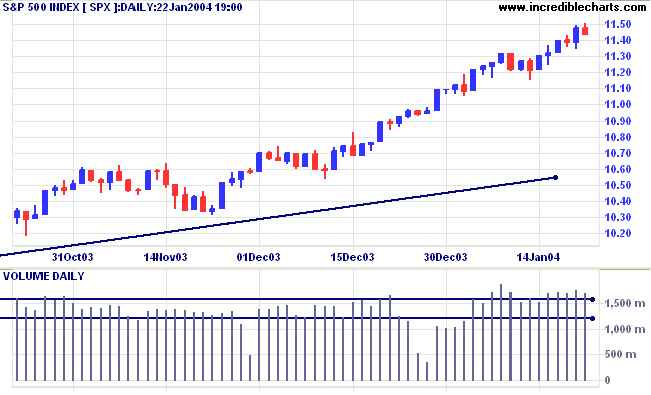
The intermediate trend is up. The next resistance level is at 1175.
Short-term: Bullish if the S&P500 is above the high of 1150. Bearish below 1115 (last Tuesday's low).
Intermediate: Bullish above 1115.
Long-term: Bullish above 1000.
The software giant reports strong sales but lower earnings for the quarter, after employee stock option charges.(more)
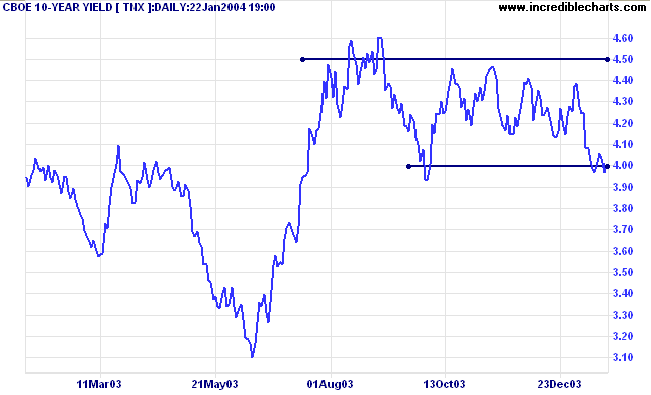
The yield on 10-year treasury notes closed lower at 3.97%, ending a 2-day retracement.
The intermediate trend is down. The 2-day retracement is a bearish sign, signaling a fast down-trend.
The primary trend is up. A close below 3.93% will signal reversal.
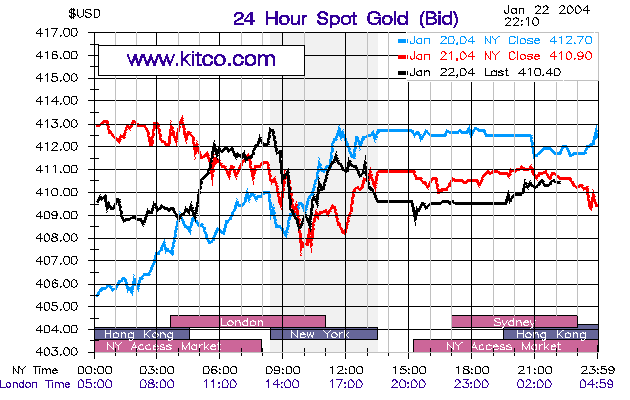
New York (16.43): Spot gold is steady at $410.40.
The intermediate trend is up.
The primary trend is up.
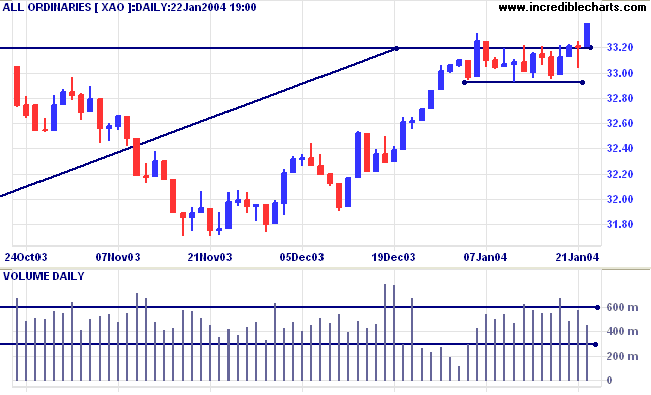
Short-term: Bullish above 3320. Bearish below 3293.
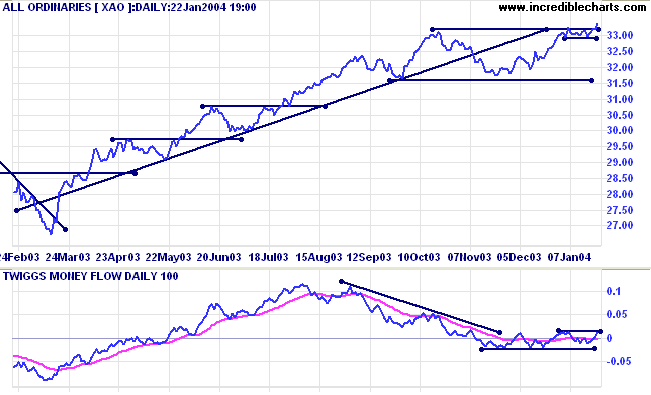
Twiggs Money Flow (100) has leveled out after a large divergence. A rise above the previous peak will be a bull signal.
Intermediate term: Bullish above 3320.
Long-term: Bearish below 3160.
Last covered October 7, 2003.
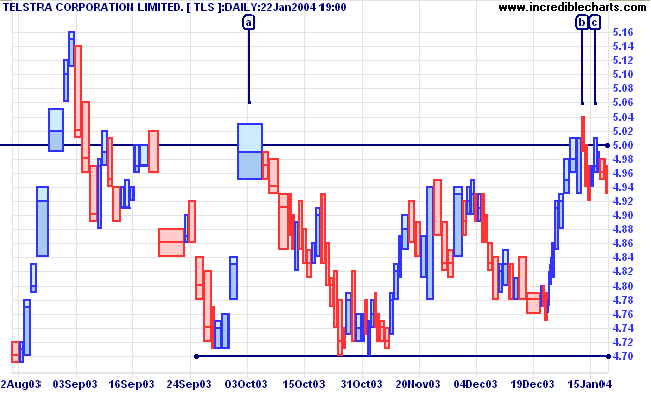
Telstra has ranged between 5.00 and 4.70 for the last 6 months. Twiggs Money Flow (100) has held below zero, signaling distribution.
Relative Strength (price ratio: xao) is neutral.
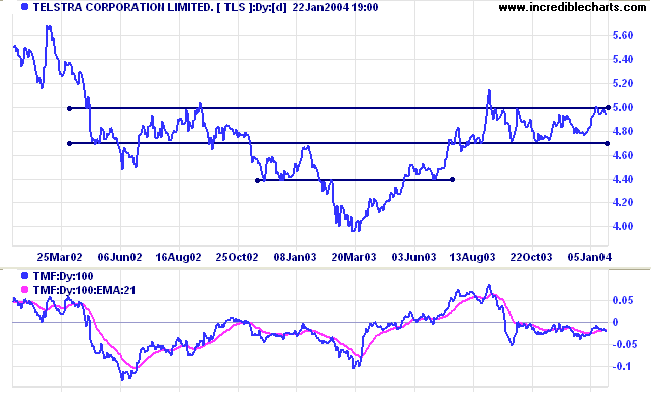
A break above or below the range would be a fairly weak signal. It would be sensible to wait for a pull-back that respects the new support/resistance level.
Last covered November 25, 2003.
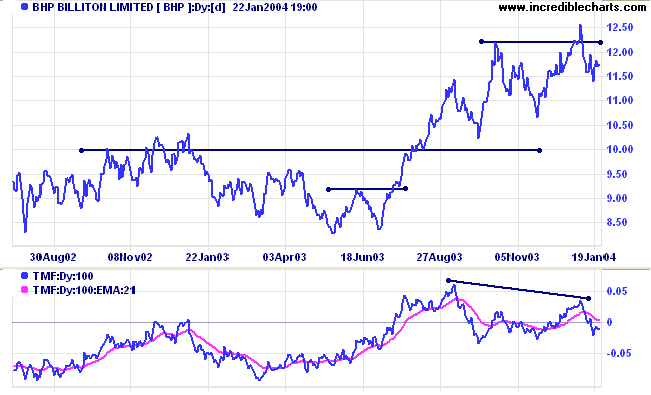
After an initial fast up-trend, in the second half of 2003, BHP has slowed to a creeping up-trend. Twiggs Money Flow (100) displays a bearish divergence. A creeping up-trend can either resume the fast up-trend or reverse into a down-trend; a precarious situation.
Last covered November 3, 2003.
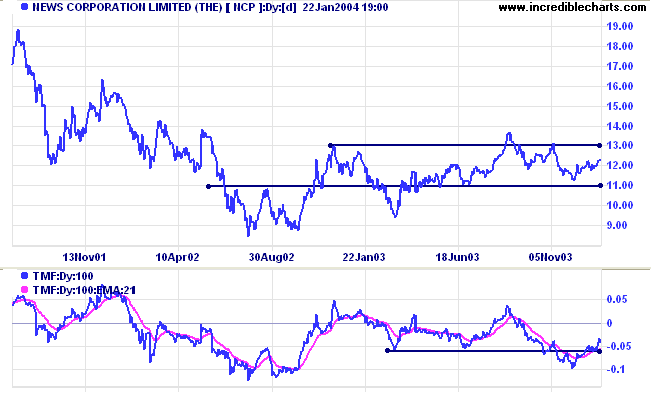
NCP is ranging between 11.00 and 13.00. Twiggs Money Flow (100) is well below zero, signaling distribution.
Based on the past record, breakouts should be treated conservatively, as with Telstra.
the best will take care of itself.
~ SA Nelson: The ABC of Stock Speculation (1903).
We would like to add more 5-star posts to the
Incredible Posts thread.
If you have any suggestions, please post the
links at
the
Suggestion box.
You can now view back issues at the Daily Trading Diary Archives.
Back Issues

Author: Colin Twiggs is a former investment banker with almost 40 years of experience in financial markets. He co-founded Incredible Charts and writes the popular Trading Diary and Patient Investor newsletters.
Using a top-down approach, Colin identifies key macro trends in the global economy before evaluating selected opportunities using a combination of fundamental and technical analysis.
Focusing on interest rates and financial market liquidity as primary drivers of the economic cycle, he warned of the 2008/2009 and 2020 bear markets well ahead of actual events.
He founded PVT Capital (AFSL No. 546090) in May 2023, which offers investment strategy and advice to wholesale clients.
