|
US stocks Our target is to have NYSE, Nasdaq and Amex charts available by Friday. |
Trading Diary
November 3, 2003
These extracts from my daily trading diary
are for educational purposes
and should not be interpreted as investment
advice. Full terms and conditions can be found at Terms
of Use .
USA
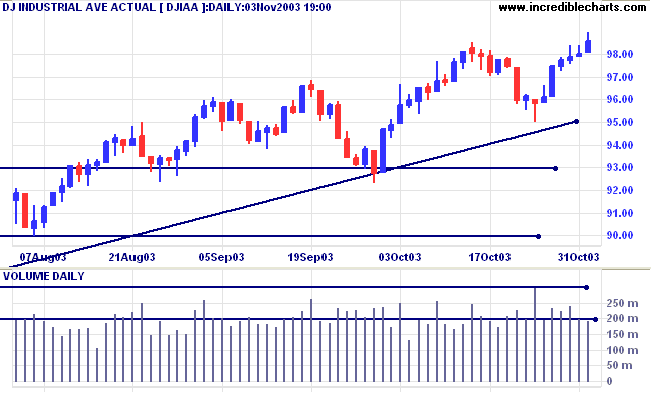
The Dow Industrial Average broke through resistance to close up
0.6% at 9858. Low volume signals potential weakness.
The intermediate trend has turned up.
The primary trend is up. A fall below 9000 will signal reversal.
The intermediate trend has turned up.
The primary trend is up. A fall below 9000 will signal reversal.
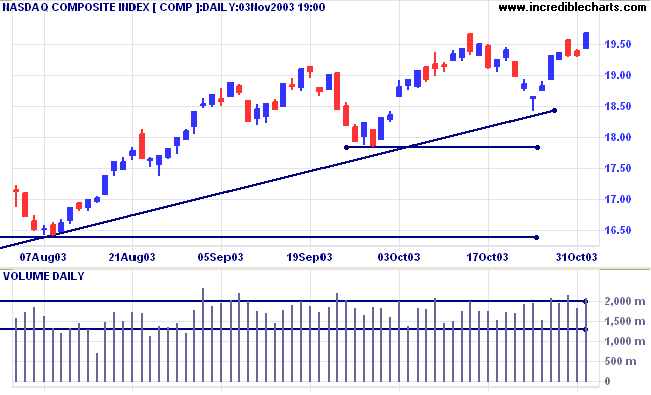
The Nasdaq Composite jumped 35 points to close at 1968 on strong
volume.
The intermediate trend has turned up.
The primary trend is up. A fall below 1640 will signal reversal.
The intermediate trend has turned up.
The primary trend is up. A fall below 1640 will signal reversal.
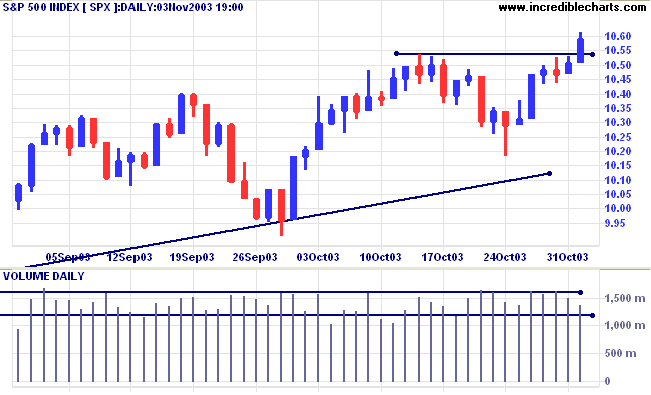
The S&P 500 closed 8 points higher at 1059 on lower
volume.
The intermediate trend has turned up.
The primary trend is up. A fall below 960 will signal reversal.
The intermediate trend has turned up.
The primary trend is up. A fall below 960 will signal reversal.
The Chartcraft NYSE Bullish % Indicator rallied
to 81.36% (November 3).
Market Strategy
Short-term: Bullish if the S&P500 is above 1054.
Intermediate: Bullish above 1054.
Long-term: Bullish above 960.
Short-term: Bullish if the S&P500 is above 1054.
Intermediate: Bullish above 1054.
Long-term: Bullish above 960.
Manufacturing surge
The ISM manufacturing index jumped to 57 in October, from 53.7 in September. (more)
The ISM manufacturing index jumped to 57 in October, from 53.7 in September. (more)
Treasury yields
The yield on 10-year treasury notes increased to 4.37%.
The intermediate down-trend is weak.
The primary trend is up.
The yield on 10-year treasury notes increased to 4.37%.
The intermediate down-trend is weak.
The primary trend is up.
Gold
New York (16:21): Spot gold plunged to $377.00.
The intermediate trend is up. Price has formed equal highs in the past 6 weeks; a fall below 370.00 will be a bear signal.
The primary trend is up. Expect resistance at 400 to 415.
New York (16:21): Spot gold plunged to $377.00.
The intermediate trend is up. Price has formed equal highs in the past 6 weeks; a fall below 370.00 will be a bear signal.
The primary trend is up. Expect resistance at 400 to 415.
ASX Australia
Selling continued, with the All Ordinaries falling 13 points to
close at 3269. Lower volume indicates that the 3238 to 3250
support band may hold, especially after the strong performance in
the US.
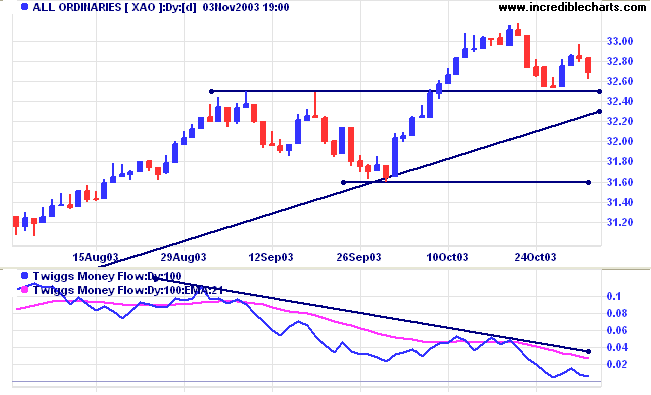
The intermediate up-trend is weak. A fall below 3250 will signal
reversal.
The primary trend is up. The rally is extended and probability of a reversal increases with each successive primary trend movement. A fall below 3160 will signal reversal.
MACD (26,12,9) is below its signal line; Slow Stochastic (20,3,3) has crossed below; Twiggs Money Flow (100) is below its signal line and displays a bearish "triple" divergence.
Market Strategy
Short-term: Bullish if the All Ords is above 3317. Bearish below 3250.
Intermediate: Bullish above 3317.
Long-term: Bullish above 3160.
Short-term: Bullish if the All Ords is above 3317. Bearish below 3250.
Intermediate: Bullish above 3317.
Long-term: Bullish above 3160.
Amalgamated Holdings [AHD]
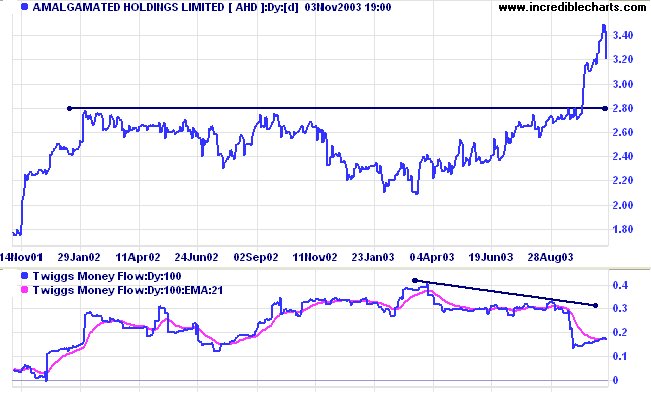
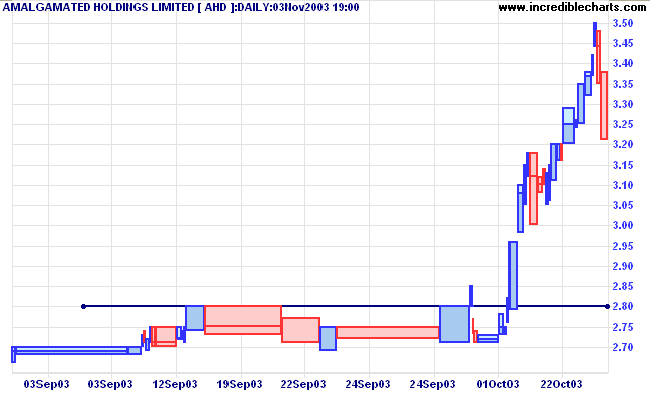
AMH, after a lengthy consolidation, broke above resistance at 2.80 but has corrected sharply in the last 2 days. Twiggs Money Flow (100) signals a bearish divergence.
AMH, after a lengthy consolidation, broke above resistance at 2.80 but has corrected sharply in the last 2 days. Twiggs Money Flow (100) signals a bearish divergence.
Relative Strength (xao) is rising. Bull signals at [+] are when
RS respects the support line from earlier highs.
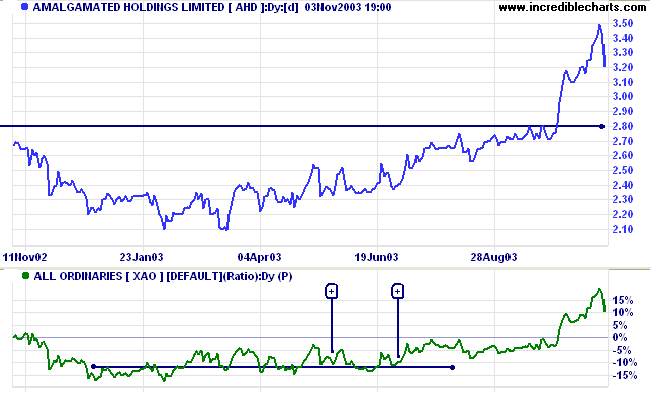
Broad equivolume bars in September indicate that price is likely
to encounter strong support at 2.80. Entry opportunities may
present themselves if RS and TMF turn upwards while price
respects the support level.
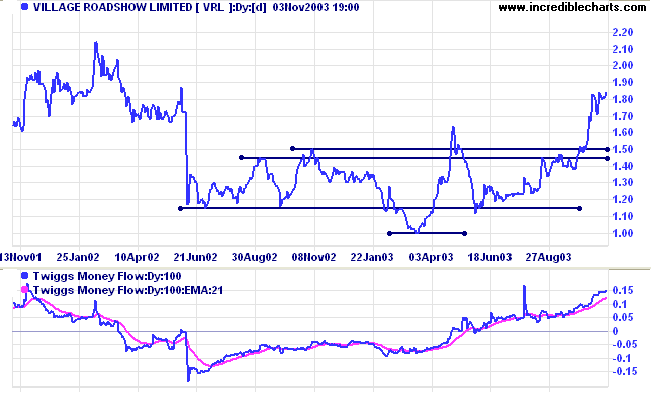
Village Roadshow [VRL]
Last covered on June 7, 2002, VRL has recovered, breaking through resistance at 1.45 to 1.50, with Twiggs Money Flow (100) rising steadily.
Last covered on June 7, 2002, VRL has recovered, breaking through resistance at 1.45 to 1.50, with Twiggs Money Flow (100) rising steadily.
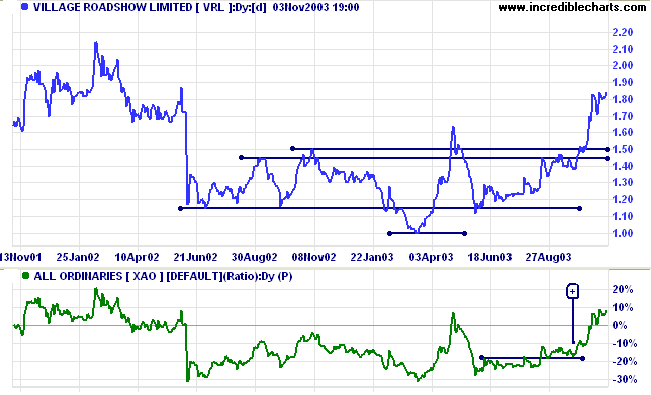
Relative Strength (price ratio: xao) presented entry
opportunities while price was consolidating just below the
resistance level, with RS respecting support [+] from previous
highs.
Price is likely to encounter resistance at 2.00, presenting opportunities to enter if there is a pull-back to re-test support levels.
Price is likely to encounter resistance at 2.00, presenting opportunities to enter if there is a pull-back to re-test support levels.
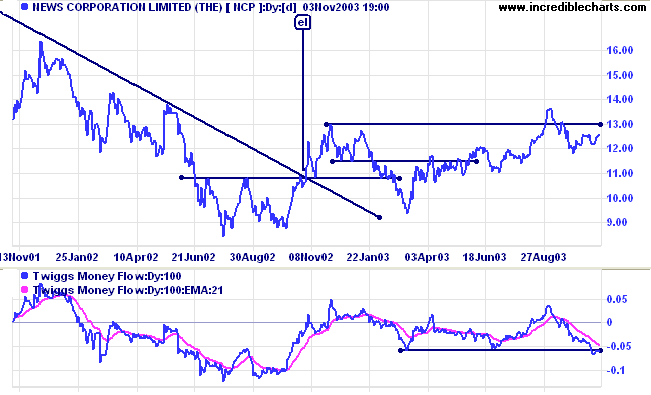
News Corporation [NCP]
NCP is in a creeping up-trend while Twiggs Money Flow (100) is falling, a bearish sign.
NCP is in a creeping up-trend while Twiggs Money Flow (100) is falling, a bearish sign.
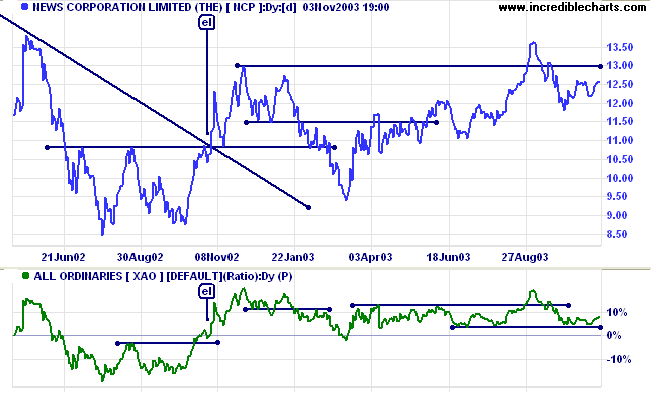
Relative Strength (xao) presented an early entry opportunity at
[el] but price reversed sharply after reaching its target
(10.80+(10.80-10.50)).
RS subsequently leveled out, providing neither bull or bear signals in the last 6 months.
RS subsequently leveled out, providing neither bull or bear signals in the last 6 months.
Understanding
the Trading Diary has been expanded to offer further
assistance to readers, including
directions on how to search the archives.
Colin Twiggs
The wavelike movement affecting the economic
system,
the recurrence of periods of boom which are followed by periods of depression [recession],
is the unavoidable outcome of the attempts, repeated again and again,
to lower the gross market rate of interest by means of credit expansion.
There is no means of avoiding the final collapse of a boom expansion brought about by credit expansion.
The alternative is only whether the crisis should come sooner
as the result of the voluntary abandonment of further credit expansion,
or later as a final and total catastrophe of the currency system involved.
~ Ludwig von Mises (1881 - 1973)
The Federal Reserve is injecting cash into the US economy to stimulate "the best recovery that money can buy",
in the words of one commentator. This is unsustainable - as reflected by the falling dollar.
Indicator Colors
|
The easiest way to change indicator
colors is to: (1) display the legend; (2) click the color button next to the indicator; (3) select a new color from the palette and lick OK. You can also use the menu: (1) select Format Charts >> Colors; (2) select the indicator (on the bottom half of the pop-up menu); (3) click the color button and select a new color. |
Back Issues
You can now view back issues at the Daily Trading Diary Archives.
You can now view back issues at the Daily Trading Diary Archives.
Back Issues
Access the Trading Diary Archives.

Author: Colin Twiggs is a former investment banker with almost 40 years of experience in financial markets. He co-founded Incredible Charts and writes the popular Trading Diary and Patient Investor newsletters.
Using a top-down approach, Colin identifies key macro trends in the global economy before evaluating selected opportunities using a combination of fundamental and technical analysis.
Focusing on interest rates and financial market liquidity as primary drivers of the economic cycle, he warned of the 2008/2009 and 2020 bear markets well ahead of actual events.
He founded PVT Capital (AFSL No. 546090) in May 2023, which offers investment strategy and advice to wholesale clients.