|
ETOs and
Warrants ETOs and warrants will be available shortly. US stocks will follow. |
Trading Diary
September 23, 2003
These extracts from my daily trading diary
are for educational purposes
and should not be interpreted as investment
advice. Full terms and conditions can be found at Terms
of Use .
USA
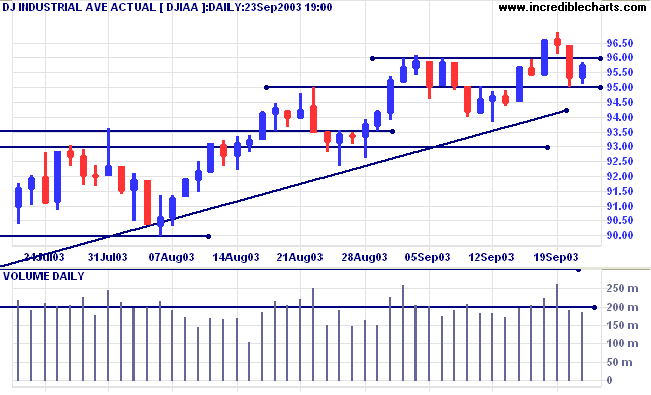
The Dow Industrial Average formed an inside day above support at
9500, closing at 9576 on low volume.
The intermediate trend is up. Continued low volume signals weakness. A fall below 9381 will be a bear signal.
The primary trend is up.
The intermediate trend is up. Continued low volume signals weakness. A fall below 9381 will be a bear signal.
The primary trend is up.
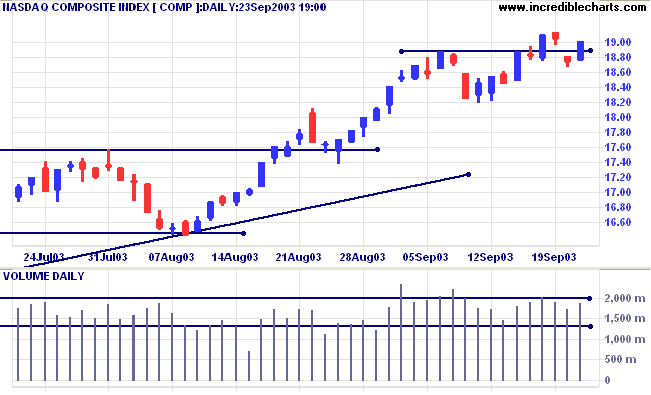
The Nasdaq Composite recovered 27 points to close at 1902 on
higher volume.
The intermediate trend is up.
The primary trend is up.
The intermediate trend is up.
The primary trend is up.
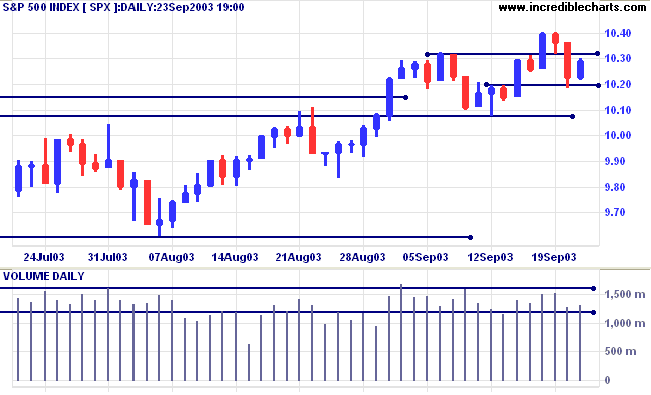
The S&P 500 consolidated with an inside day, closing 6 points
higher at 1029 on average volume.
The intermediate trend is up.
The primary trend is up.
The intermediate trend is up.
The primary trend is up.
The Chartcraft NYSE Bullish % Indicator eased
slightly to 80.64% (September 23).
Market Strategy
Short-term: Long if the S&P500 is above 1030. Short if below 1008.
Intermediate: Long if S&P 500 is above 1030.
Long-term: Long is the index is above 1008.
Short-term: Long if the S&P500 is above 1030. Short if below 1008.
Intermediate: Long if S&P 500 is above 1030.
Long-term: Long is the index is above 1008.
Small business optimistic
A survey of small-business owners reflects a large jump in optimism. (more)
A survey of small-business owners reflects a large jump in optimism. (more)
Treasury yields
The yield on 10-year treasury notes eased to 4.21%, above the band of support at 4.10% to 4.00%.
The intermediate and primary trends are both up.
The yield on 10-year treasury notes eased to 4.21%, above the band of support at 4.10% to 4.00%.
The intermediate and primary trends are both up.
Gold
The first chart I check every morning is gold. The New York (19.17) spot gold price has eased to $384.60.
The primary trend is up.
The target for the symmetrical triangle is calculated as 426 (365 + 382 - 321). But expect heavy resistance at 400 to 415 (the 10-year high).
The first chart I check every morning is gold. The New York (19.17) spot gold price has eased to $384.60.
The primary trend is up.
The target for the symmetrical triangle is calculated as 426 (365 + 382 - 321). But expect heavy resistance at 400 to 415 (the 10-year high).
ASX Australia
The All Ordinaries lost a further 13 points to close at 3187 on
strong volume.
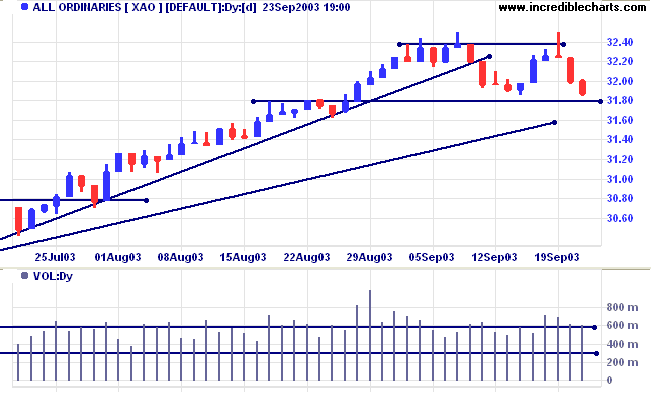
The intermediate up-trend is weak, with the index having broken
its intermediate trendline and formed two equal highs. A break
below 3180 will signal a reversal.
The primary trend is up.
MACD (26,12,9) is below its signal line; Slow Stochastic (20,3,3) has crossed to below;
Twiggs Money Flow signals distribution, after a bearish divergence.
The primary trend is up.
MACD (26,12,9) is below its signal line; Slow Stochastic (20,3,3) has crossed to below;
Twiggs Money Flow signals distribution, after a bearish divergence.
Market Strategy
Short-term: Long above 3201. Short if below 3180.
Intermediate: Long if the index is above 3201.
Long-term: Long if the index is above 3180.
Short-term: Long above 3201. Short if below 3180.
Intermediate: Long if the index is above 3201.
Long-term: Long if the index is above 3180.
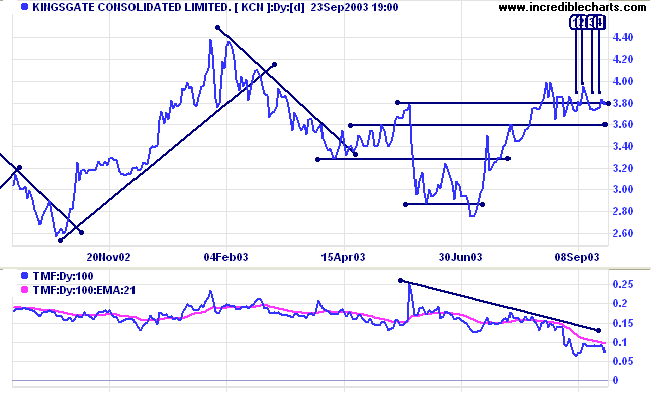
Kingsgate [KCN]
Last covered September 9, 2003.
Several gold stocks are, understandably, in fast up-trends. There are one or two laggards, however, that warrant closer inspection.
KCN has consolidated below resistance at 4.00 with Twiggs Money Flow (100) showing a bearish divergence.
Last covered September 9, 2003.
Several gold stocks are, understandably, in fast up-trends. There are one or two laggards, however, that warrant closer inspection.
KCN has consolidated below resistance at 4.00 with Twiggs Money Flow (100) showing a bearish divergence.
Relative Strength (Price Ratio: XAO) is oscillating in a narrow
range after a healthy rise. MACD is neutral.
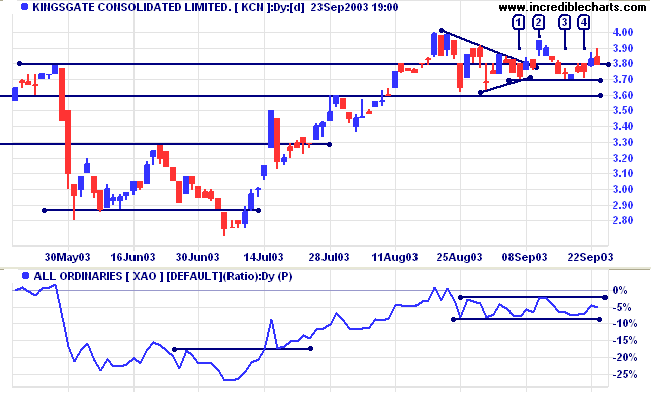
Price broke out of a pennant at [2] but has failed to rally,
pulling back to re-test support at 3.70. Volume has dried up at
[3] and [4], at the support level; a bullish sign.
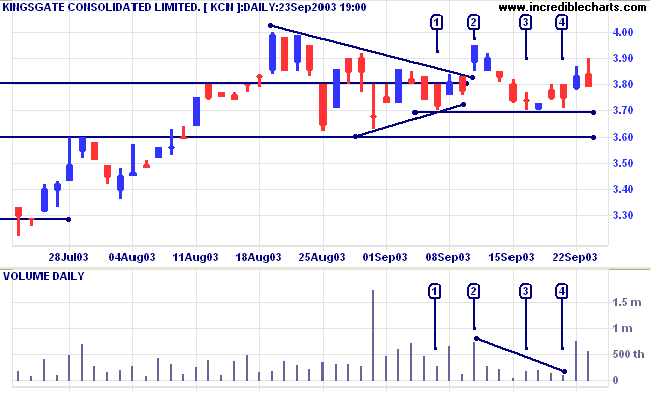
In the short-term, a rise above 3.95 will be bullish, while a
fall below 3.70 would be bearish.
In the intermediate term, a fall below 3.60 would be a bear signal, while a rise above 4.00 will be bullish.
In the intermediate term, a fall below 3.60 would be a bear signal, while a rise above 4.00 will be bullish.
Sons of Gwalia [SGW]
Last covered September 9, 2003.
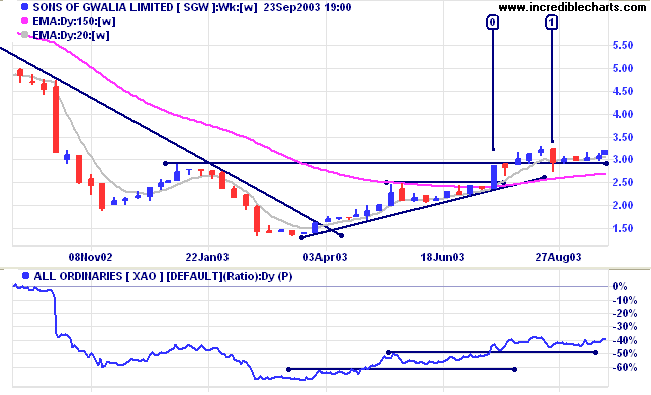
SGW has also been a bit slow out of the blocks, consolidating around 3.00 after a bullish ascending triangle at 2.50.
Twiggs Money Flow (100) signals accumulation after a bullish divergence, while MACD has formed two bullish troughs above zero.
Last covered September 9, 2003.
SGW has also been a bit slow out of the blocks, consolidating around 3.00 after a bullish ascending triangle at 2.50.
Twiggs Money Flow (100) signals accumulation after a bullish divergence, while MACD has formed two bullish troughs above zero.
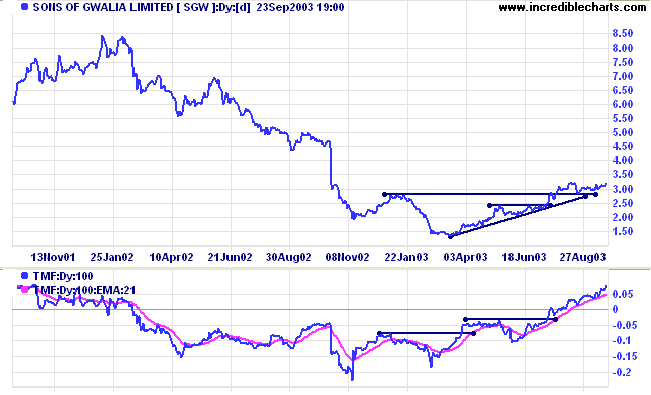
Relative Strength (price ratio: xao) is rising steadily.
After the false break of the 2.80 support level at [1], price has
formed higher equal lows at [2] and [3]. The first low is
accompanied by low volume but the low at [3] shows higher volume.
I believe this to be due to buying support, because price
respects the support level, although the close is not
sufficiently weak to confirm this.
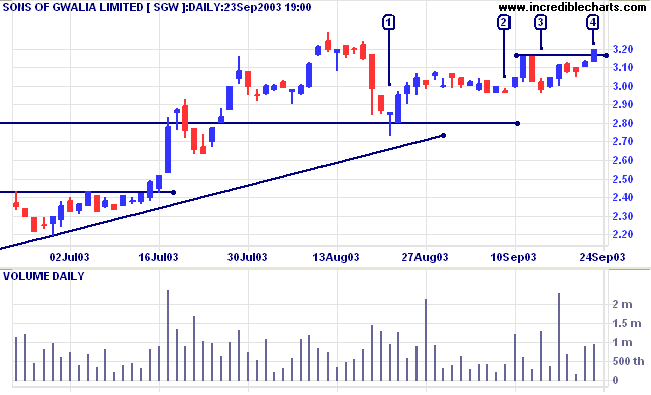
A rise above 3.29 will be an intermediate bull signal, while a
fall below 2.80 would be bearish.
Colin Twiggs
One of the most helpful things that anybody can
learn is to give up trying to catch the last eighth - or the
first.
These two are the most expensive eighths in the world.
~ Edwin Lefevre: Reminiscences of a Stock Operator (1923).
These two are the most expensive eighths in the world.
~ Edwin Lefevre: Reminiscences of a Stock Operator (1923).
|
Relative Strength/ Price
Ratio Thank you for the posts regarding Price Ratio and Price Comparison. There appear to be some members who prefer the existing method of calculation and it may be necessary to offer both options, at least for Relative Strength/Price Ratio. If you would like to express your opinion, please post at Chart Forum: Indicators. |
Back Issues
You can now view back issues at the Daily Trading Diary Archives.
You can now view back issues at the Daily Trading Diary Archives.
Back Issues
Access the Trading Diary Archives.

Author: Colin Twiggs is a former investment banker with almost 40 years of experience in financial markets. He co-founded Incredible Charts and writes the popular Trading Diary and Patient Investor newsletters.
Using a top-down approach, Colin identifies key macro trends in the global economy before evaluating selected opportunities using a combination of fundamental and technical analysis.
Focusing on interest rates and financial market liquidity as primary drivers of the economic cycle, he warned of the 2008/2009 and 2020 bear markets well ahead of actual events.
He founded PVT Capital (AFSL No. 546090) in May 2023, which offers investment strategy and advice to wholesale clients.