|
The latest version of Incredible Charts is now available.
Your version should automatically update when you login to
the server. Check under Help >> About to
confirm that you have received the update. If you experience a timeout error, download the latest version and install over your present version. This will not affect your watchlists and indicator settings. See What's New for further details. |
Trading Diary
January 21, 2004
USA
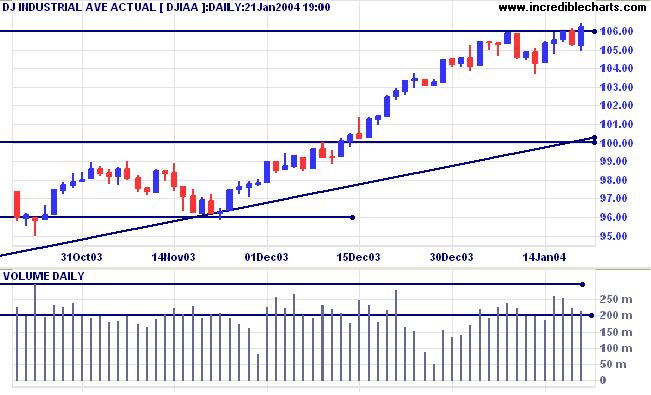
The intermediate trend is up.
The primary trend is up. A fall below support at 9600 will signal reversal.
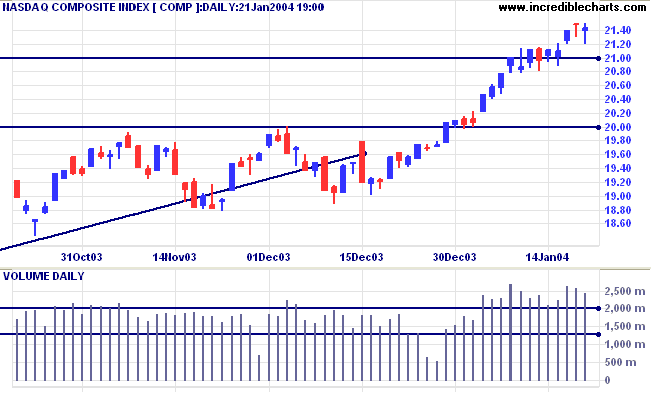
The intermediate trend is up.
The primary trend is up. A fall below support at 1640 will signal reversal.
The intermediate trend is up.
Short-term: Bullish if the S&P500 is above 1140 (Friday's high). Bearish below 1115 (last Tuesday's low).
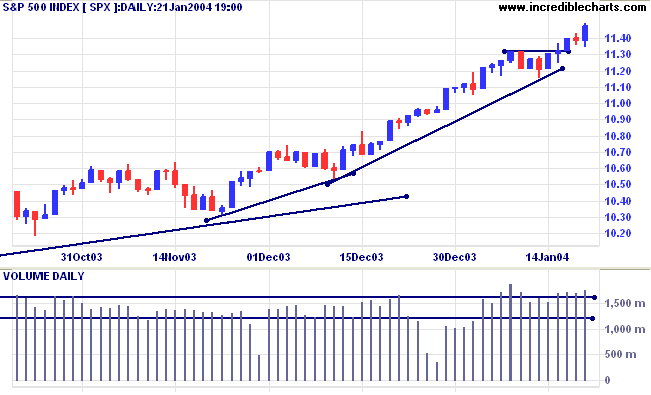
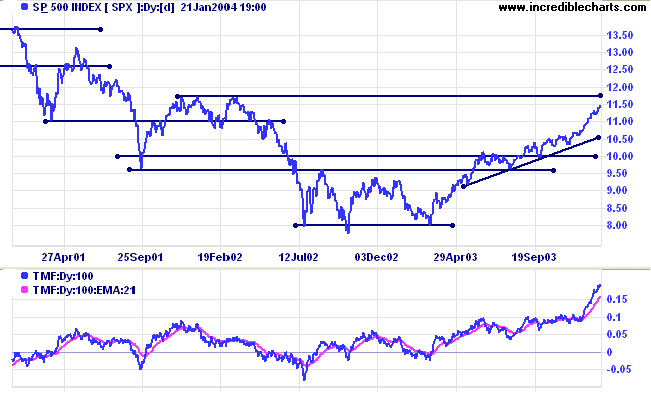
The primary trend is up. A fall below 960 will signal reversal (on reflection, 1000 is significant, but not a primary support level).
Intermediate: Bullish above 1115 (last Tuesday's low).
Long-term: Bullish above 1000.
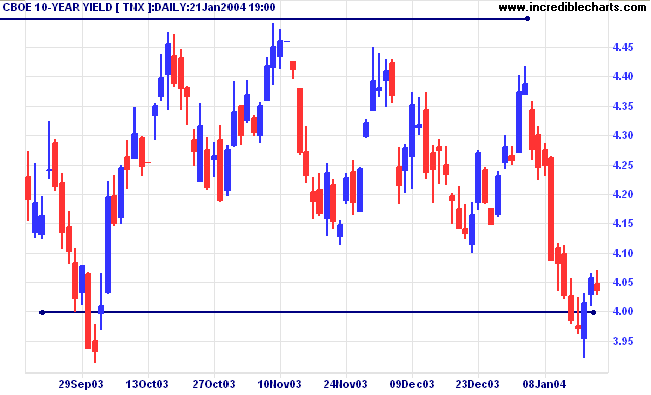
The yield on 10-year treasury notes stalled, forming an inside day with a close at 4.03%. This is a bearish sign: a 2-day correction would signal a fast down-trend.
The intermediate trend is down.
The primary trend is up. A close below 3.93% will signal reversal.
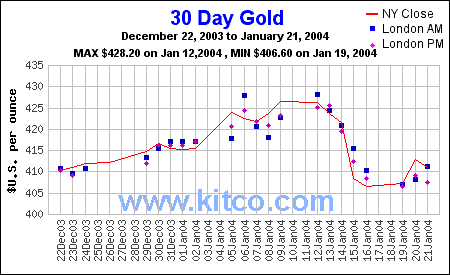
New York (22.56): Spot gold eased to $410.20.
The intermediate trend is up, but a fall to 405 would signal reversal.
The primary trend is up.
Short-term: Bullish above 3320. Bearish below 3293.
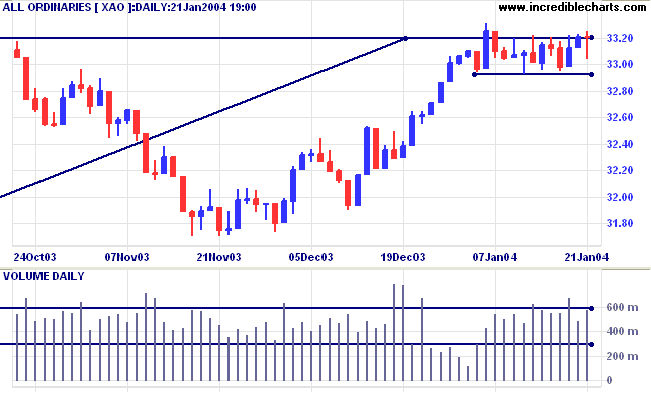
The primary trend is up but will reverse if there is a fall below 3160.
Twiggs Money Flow (100) has leveled out but is still bearish after a large divergence.
Intermediate term: Bullish above 3320. Bearish below 3160.
Long-term: Bearish below 3160.
Last covered September 24, 2003.
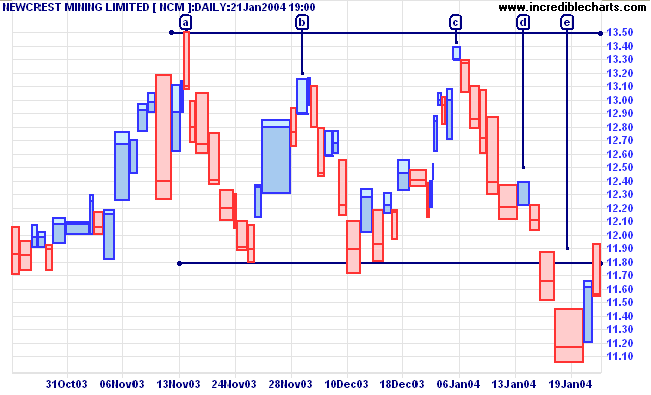
NCM broke below support from the recent consolidation, testing the primary supporting trendline.
Twiggs Money Flow (100) displays a bearish divergence.
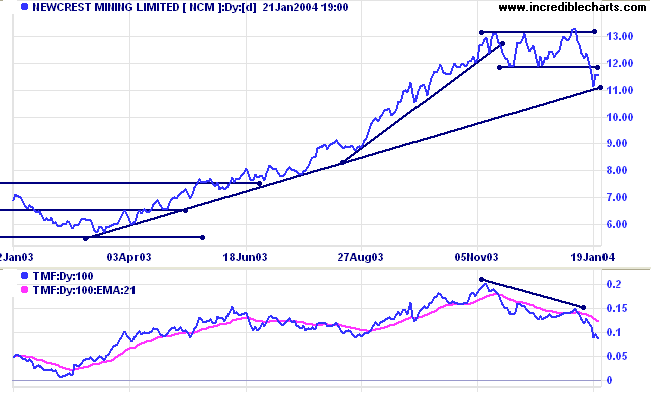
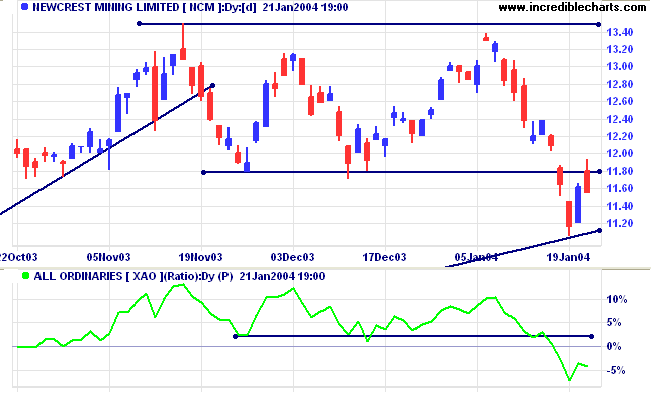
A fall below the low of [e] would be a strong bear signal. A close below the long-term trendline would add further confirmation.
A (low probability) rally above 13.50 would be a bull signal.
Last covered September 23, 2003.
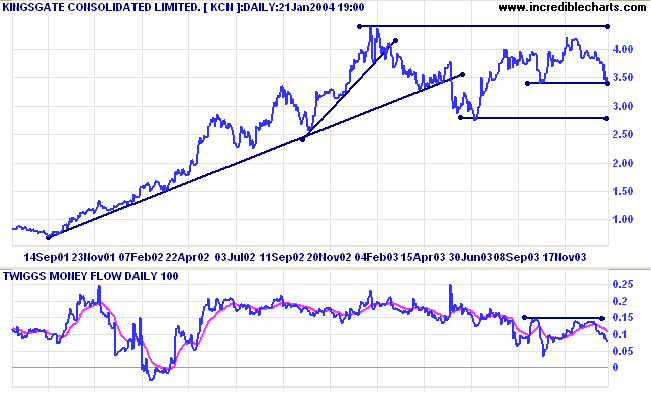
KCN is also testing an important support level at 3.40, with a target of 2.80 if there is a downward breakout.
Last covered November 13, 2003.
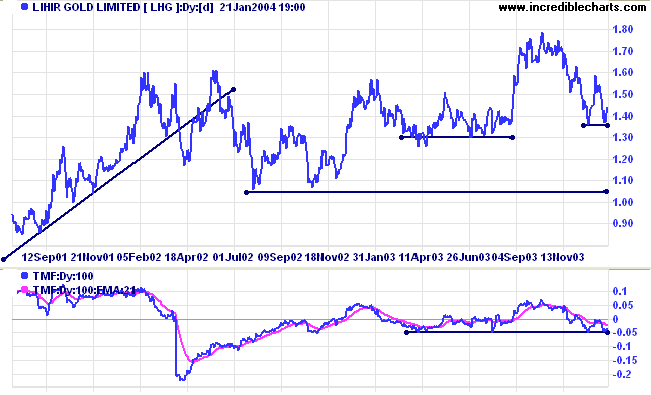
LHG faces a likely target of 1.10 if price breaks below 1.35.
And that is precisely what beats so many men in Wall Street
who are very far from being in the main sucker class.
There is the plain fool, who does the wrong thing at all times everywhere,
but there is the Wall Street fool, who thinks he must trade all the time.
~ Edwin Lefevre: Reminiscences of a Stock Operator (1923).
We would like to add more 5-star posts to the
Incredible Posts thread.
If you have any suggestions, please post the
links at
the
Suggestion box.
You can now view back issues at the Daily Trading Diary Archives.
Back Issues

Author: Colin Twiggs is a former investment banker with almost 40 years of experience in financial markets. He co-founded Incredible Charts and writes the popular Trading Diary and Patient Investor newsletters.
Using a top-down approach, Colin identifies key macro trends in the global economy before evaluating selected opportunities using a combination of fundamental and technical analysis.
Focusing on interest rates and financial market liquidity as primary drivers of the economic cycle, he warned of the 2008/2009 and 2020 bear markets well ahead of actual events.
He founded PVT Capital (AFSL No. 546090) in May 2023, which offers investment strategy and advice to wholesale clients.