|
ETOs and
Warrants ETOs and warrants will be available shortly. US stocks will follow. |
Trading Diary
September 24, 2003
These extracts from my daily trading diary
are for educational purposes
and should not be interpreted as investment
advice. Full terms and conditions can be found at Terms
of Use .
USA
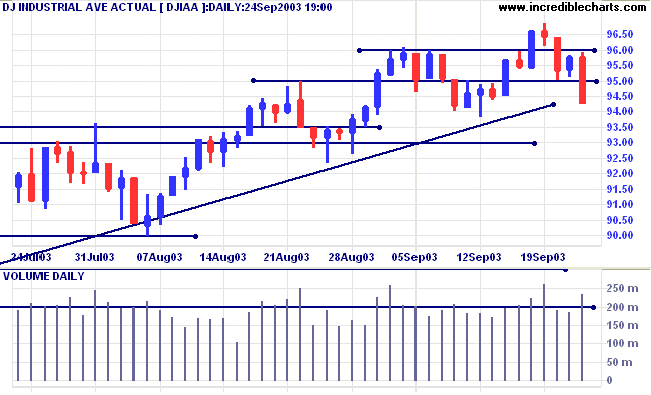
The Dow Industrial Average continued the down-swing, falling 1.6%
to close at 9426 on higher volume, a bearish sign.
The intermediate trend is up. Low volume in the past month signals weakness. A fall below 9381 will be a further bear signal.
The primary trend is up.
The intermediate trend is up. Low volume in the past month signals weakness. A fall below 9381 will be a further bear signal.
The primary trend is up.
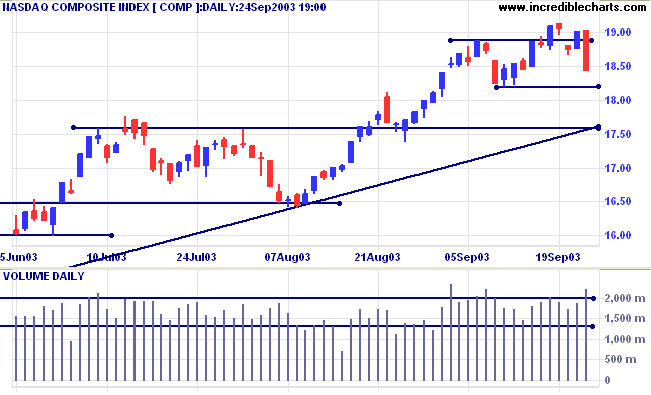
The Nasdaq Composite fell 3.0% to close at 1844 on strong
volume.
The intermediate trend has turned down and we may see a re-test of the long-term supporting trendline.
The primary trend is up.
The intermediate trend has turned down and we may see a re-test of the long-term supporting trendline.
The primary trend is up.
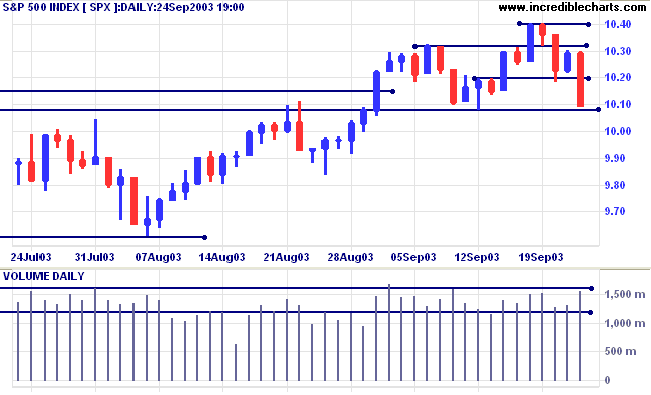
The S&P 500 continued the down-swing, closing 20 points lower
at 1009 on higher volume.
The intermediate trend is up. A fall below 1008 will be bearish, while a fall below 1000 will be a stronger signal.
The primary trend is up.
The intermediate trend is up. A fall below 1008 will be bearish, while a fall below 1000 will be a stronger signal.
The primary trend is up.
The Chartcraft NYSE Bullish % Indicator eased to
80.49% (September 24).
Market Strategy
Short-term: Long if the S&P500 is above 1030. Short if below 1000.
Intermediate: Long if S&P 500 is above 1030.
Long-term: Long if the index is above 1008.
Short-term: Long if the S&P500 is above 1030. Short if below 1000.
Intermediate: Long if S&P 500 is above 1030.
Long-term: Long if the index is above 1008.
OPEC raises prices
OPEC countries agree to cut production, causing a jump in oil prices. (more)
OPEC countries agree to cut production, causing a jump in oil prices. (more)
"Do-not-call" list
The FTC is being challenged in the courts in its attempt to set up a national do-not-call list, preventing tele-marketers from making calls to listed private numbers. (more)
An idea that should be considered in Australia.
The FTC is being challenged in the courts in its attempt to set up a national do-not-call list, preventing tele-marketers from making calls to listed private numbers. (more)
An idea that should be considered in Australia.
Treasury yields
The yield on 10-year treasury notes closed down at 4.13%.
The intermediate trend has turned down, headed for a test of support at 4.10% to 4.00%.
The primary trend is up.
The yield on 10-year treasury notes closed down at 4.13%.
The intermediate trend has turned down, headed for a test of support at 4.10% to 4.00%.
The primary trend is up.
Gold
New York (19:35) Spot Gold has retreated to $388.20, after reaching 389.20.
The primary trend is up.
The target for the symmetrical triangle is calculated as 426 (365 + 382 - 321) but expect heavy resistance between 400 and 415 (the 10-year high).
New York (19:35) Spot Gold has retreated to $388.20, after reaching 389.20.
The primary trend is up.
The target for the symmetrical triangle is calculated as 426 (365 + 382 - 321) but expect heavy resistance between 400 and 415 (the 10-year high).
ASX Australia
The All Ordinaries rallied 27 points to close at 3214 on strong
volume.
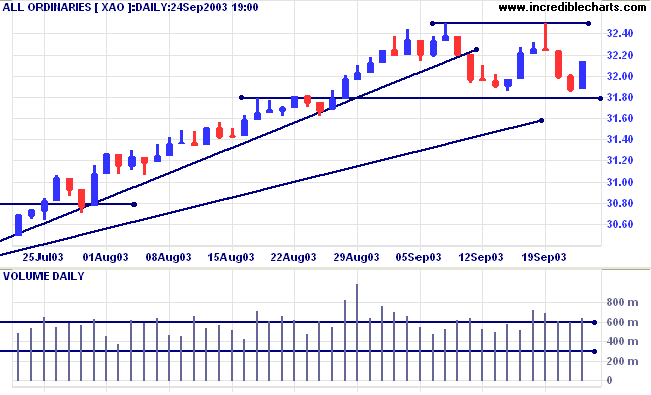
The intermediate up-trend has broken its trendline but equal
lows, above support at 3180, are a bullish sign.
A fall below 3180 would signal a reversal.
The primary trend is up.
MACD (26,12,9) is below its signal line; Slow Stochastic (20,3,3) is below;
Twiggs Money Flow has turned up, below zero, after a bearish divergence.
A fall below 3180 would signal a reversal.
The primary trend is up.
MACD (26,12,9) is below its signal line; Slow Stochastic (20,3,3) is below;
Twiggs Money Flow has turned up, below zero, after a bearish divergence.
Market Strategy
Short-term: Long above 3201. Short if below 3180.
Intermediate: Long if the index is above 3201.
Long-term: Long if the index is above 3180.
Short-term: Long above 3201. Short if below 3180.
Intermediate: Long if the index is above 3201.
Long-term: Long if the index is above 3180.
More Gold
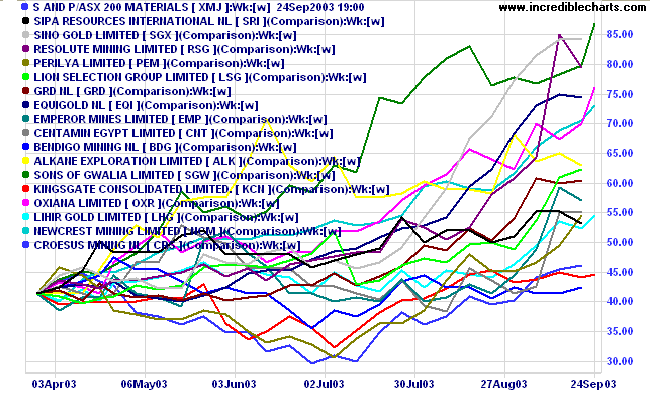
Of twenty ASX 300 stocks with the highest relative strength for the last month, 8 are gold stocks. The 6-month comparison chart shows a similar bullish picture.
Of twenty ASX 300 stocks with the highest relative strength for the last month, 8 are gold stocks. The 6-month comparison chart shows a similar bullish picture.
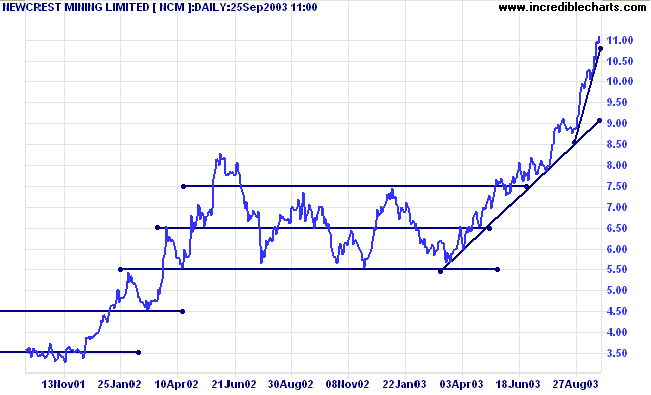
Take Newcrest [NCM] as an example. Relative Strength (price
ratio: xao), MACD and Twiggs Money Flow all give strong bull
signals. But long-term traders should be extremely
cautious.
Price has accelerated from a fast trend towards a blow-off spike. This a self-reinforcing cycle where the higher price rises, the more investors are convinced that prices will go higher. There is only one outcome: an eventual sharp correction back to the longer-term trendline, when fear overcomes euphoria.
Price has accelerated from a fast trend towards a blow-off spike. This a self-reinforcing cycle where the higher price rises, the more investors are convinced that prices will go higher. There is only one outcome: an eventual sharp correction back to the longer-term trendline, when fear overcomes euphoria.
Short-term traders may still enter on corrections but they need
to keep stops tight and move them up below each successive
trough, to lock in profits.
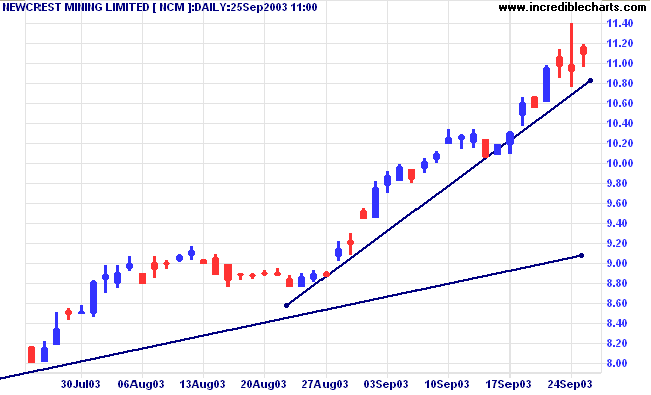
Price has not yet entered the final phase of a blow-off. This can
normally be identified by a further acceleration of the trend, to
the the point where the trendline is almost vertical, with high
volume, frequent gaps, and corrections seldom lasting more than a
day.
In the final phase of a blow-off, I prefer to switch to a trailing percentage stop of 6% or 8%, depending on the volatility of the stock. It is important to calculate the trailing stop on intra-day highs and not merely on closing price as many brokers do.
In the final phase of a blow-off, I prefer to switch to a trailing percentage stop of 6% or 8%, depending on the volatility of the stock. It is important to calculate the trailing stop on intra-day highs and not merely on closing price as many brokers do.
Colin Twiggs
The average man, who never thinks of values but
of prices,
and is not governed by conditions but by fears,
takes the easiest way - he stops thinking that there must be a limit to the advances.
~ Edwin Lefevre: Reminiscences of a Stock Operator (1923).
and is not governed by conditions but by fears,
takes the easiest way - he stops thinking that there must be a limit to the advances.
~ Edwin Lefevre: Reminiscences of a Stock Operator (1923).
|
Stock Screening: Relative
Strength To screen for Relative Strength, I use the % Price Move filter. For example, to find the relative strength of securities over a 1-month time frame: (1) select the ASX 200 or ASX 300 under Indexes & Watchlists; (2) open % Price Move; (3) enter 9999 as the 1-month Maximum; (4) Submit; and (5) sort the results by clicking at the top of the %M(1M) column. To screen for RS over 1 year, simply enter 9999 as the 1-year Maximum instead. |
Back Issues
You can now view back issues at the Daily Trading Diary Archives.
You can now view back issues at the Daily Trading Diary Archives.
Back Issues
Access the Trading Diary Archives.

Author: Colin Twiggs is a former investment banker with almost 40 years of experience in financial markets. He co-founded Incredible Charts and writes the popular Trading Diary and Patient Investor newsletters.
Using a top-down approach, Colin identifies key macro trends in the global economy before evaluating selected opportunities using a combination of fundamental and technical analysis.
Focusing on interest rates and financial market liquidity as primary drivers of the economic cycle, he warned of the 2008/2009 and 2020 bear markets well ahead of actual events.
He founded PVT Capital (AFSL No. 546090) in May 2023, which offers investment strategy and advice to wholesale clients.