
Trading Diary
November 10, 2003
These extracts from my daily trading diary are
for educational purposes and should not be interpreted as
investment advice. Full terms and conditions can be found at
Terms
of Use .
USA
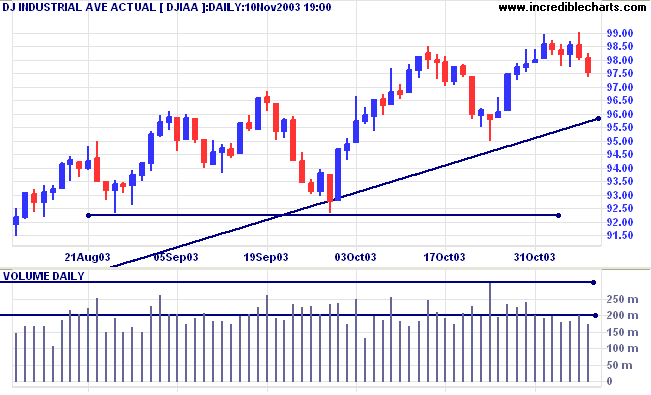
The Dow Industrial Average retreated to 9757 on encouragingly low
volume.
The intermediate trend is down.
The primary trend is up. A fall below 9000 will signal reversal.
The intermediate trend is down.
The primary trend is up. A fall below 9000 will signal reversal.
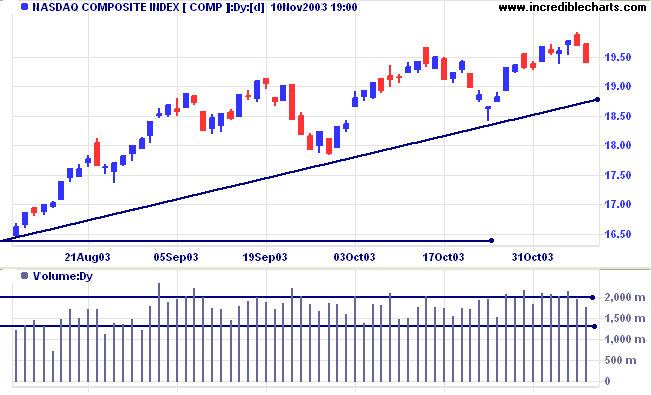
The Nasdaq Composite fell 29 points to close at 1942 on lower
volume.
The intermediate trend is up. Expect resistance at 2000 to 2060.
The primary trend is up. A fall below 1640 will signal reversal.
The intermediate trend is up. Expect resistance at 2000 to 2060.
The primary trend is up. A fall below 1640 will signal reversal.
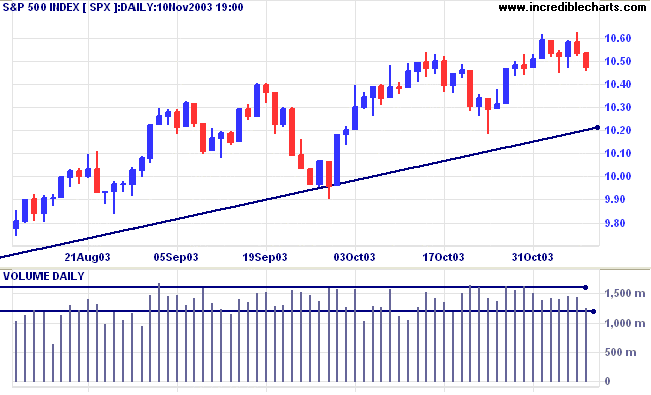
The S&P 500 fell 6 points to close at 1047 on lower
volume.
The intermediate trend is up. Expect resistance at 1100.
The primary trend is up. A fall below 960 will signal reversal.
The intermediate trend is up. Expect resistance at 1100.
The primary trend is up. A fall below 960 will signal reversal.
The Chartcraft NYSE Bullish % Indicator declined
to 81.34% (November 10).
Market Strategy
Short-term: Bullish if the S&P500 is above 1062. Bearish below 1045.
Intermediate: Bullish above 1062.
Long-term: Bullish above 960.
Short-term: Bullish if the S&P500 is above 1062. Bearish below 1045.
Intermediate: Bullish above 1062.
Long-term: Bullish above 960.
Tech stocks lower
Despite several chip stock upgrades, techs sank lower at the start of the week. (more)
Despite several chip stock upgrades, techs sank lower at the start of the week. (more)
Treasury yields
The yield on 10-year treasury notes increased slightly to 4.46%.
The intermediate trend is up.
The primary trend is up.
The yield on 10-year treasury notes increased slightly to 4.46%.
The intermediate trend is up.
The primary trend is up.
Gold
New York (16:49): Spot gold has recovered to $385.70.
The intermediate trend is up.
The primary trend is up. Expect resistance at 400 to 415.
New York (16:49): Spot gold has recovered to $385.70.
The intermediate trend is up.
The primary trend is up. Expect resistance at 400 to 415.
ASX Australia
The All Ordinaries tested support at 3238 to 3250, closing at
3248 on higher volume.
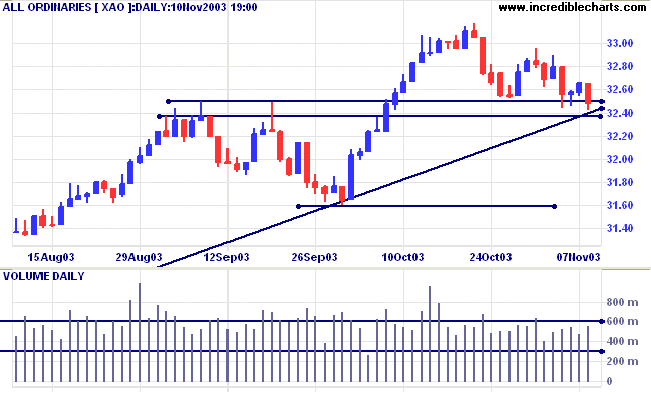
The intermediate trend has turned down but still needs to
overcome support at 3238 to 3250.
The primary trend is up. The rally is extended and probability of a reversal increases with each successive primary trend movement. The index is testing the primary trendline, but only a fall below 3160 will signal reversal.
MACD (26,12,9) is below its signal line; Slow Stochastic (20,3,3) is below; Twiggs Money Flow (100) is below its signal line and displays a bearish "triple" divergence.
Market Strategy
Short-term: Bullish if the All Ords is above 3267. Bearish below 3238.
Intermediate: Bullish above 3267.
Long-term: Bullish above 3160.
Short-term: Bullish if the All Ords is above 3267. Bearish below 3238.
Intermediate: Bullish above 3267.
Long-term: Bullish above 3160.
Westpac [WBC]
Last covered October 27, 2003.
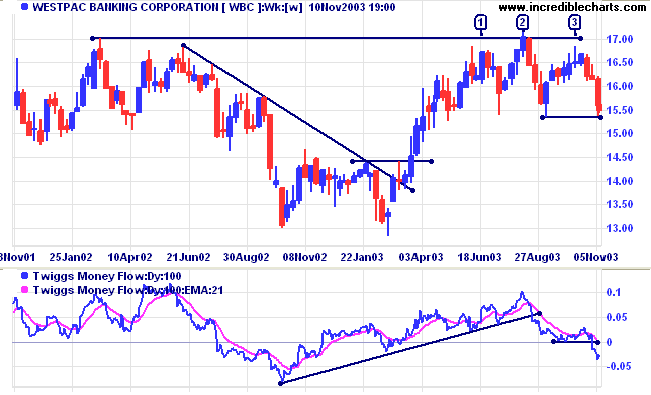
After a false break above the previous high of 17.00 at [2], WBC threatens to complete a head and shoulders reversal. The head is at [2], with shoulders at [1] and [3]. I prefer to draw the neckline horizontally from the low between [2] and [3], at 15.35. This is not in accordance with the classic H&S chart pattern, which would draw a sloping neckline, but it does coincide with a trend change in terms of Dow Theory: a lower high at [3] followed by a break below the previous low - to me a more meaningful signal.
Twiggs Money Flow (100) displays a strong bear signal, falling below the previous low as well as crossing below zero.
Last covered October 27, 2003.
After a false break above the previous high of 17.00 at [2], WBC threatens to complete a head and shoulders reversal. The head is at [2], with shoulders at [1] and [3]. I prefer to draw the neckline horizontally from the low between [2] and [3], at 15.35. This is not in accordance with the classic H&S chart pattern, which would draw a sloping neckline, but it does coincide with a trend change in terms of Dow Theory: a lower high at [3] followed by a break below the previous low - to me a more meaningful signal.
Twiggs Money Flow (100) displays a strong bear signal, falling below the previous low as well as crossing below zero.
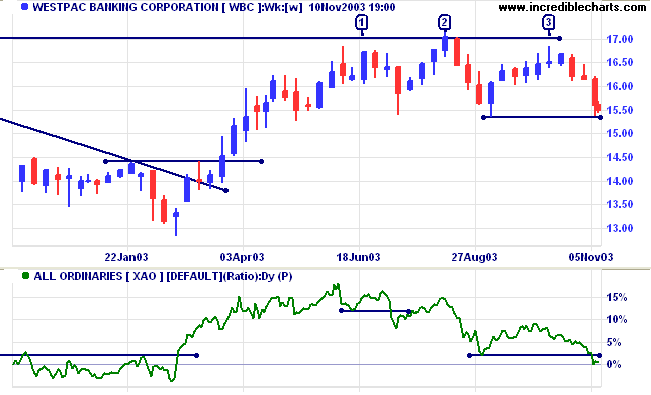
Relative Strength (xao) has been falling for some time, after a
bearish divergence at [1].
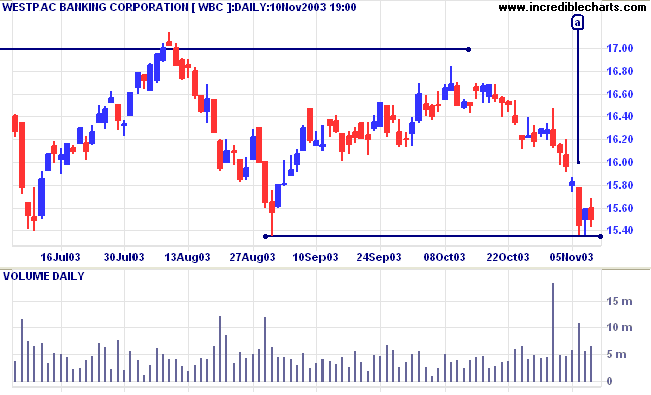
Price respected the support level at [a]. Consolidation just
above 15.35 will be a further bear signal.
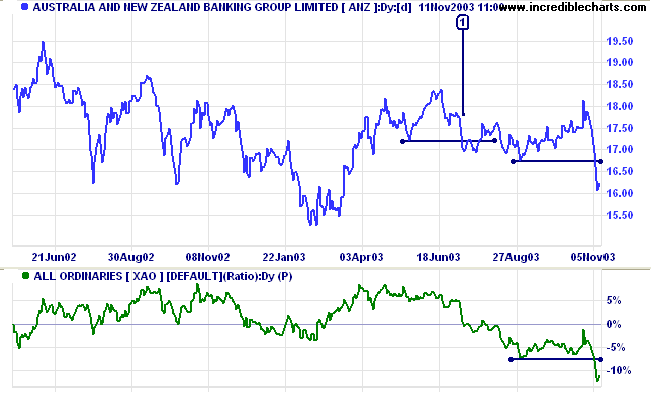
ANZ Bank [ANZ]
Last covered October 16, 2003.
ANZ continues to fall after an earlier trend reversal at [1]. Relative Strength (xao) and Twiggs Money Flow (100) are bearish.
Last covered October 16, 2003.
ANZ continues to fall after an earlier trend reversal at [1]. Relative Strength (xao) and Twiggs Money Flow (100) are bearish.
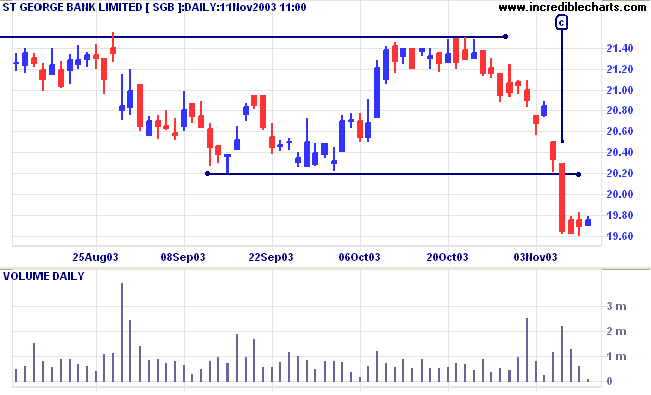
St George Bank [SGB]
Last covered November 6, 2003.
SGB appears to be consolidating after the sharp drop at [c]. Declining volume supports a bearish continuation signal.
Last covered November 6, 2003.
SGB appears to be consolidating after the sharp drop at [c]. Declining volume supports a bearish continuation signal.
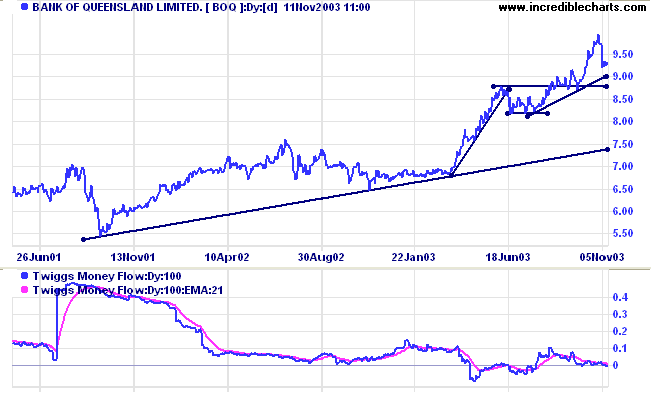
Bank of Queensland [BOQ]
Last covered on July 7, 2003 (before the rights issue on August 20, 2003 with a dilution factor 0.98).
I will be watching stocks such as BOQ, which have not followed the sector trend, for signs of weakness.
Last covered on July 7, 2003 (before the rights issue on August 20, 2003 with a dilution factor 0.98).
I will be watching stocks such as BOQ, which have not followed the sector trend, for signs of weakness.
Understanding
the Trading Diary has been expanded to offer further
assistance to readers, including directions on how to search the
archives.
Colin Twiggs
|
So far as any inferences from the
Dow-Jones stock averages is concerned
the major bull market in stocks is still
ruling......... Sometime, and probably next year, we shall experience a marked shortage of capital for investment and speculation, and the stock market will know it first. It will develop a major downward movement, when the whole country is bubbling with prosperity and ever expanding hope. ~ William Peter Hamilton: The Wall Street Journal (November 9, 1925). |
(shades of Von Mises' credit expansion)
Apologies for the late update of US
indexes
The error was due to manual intervention on our part.
The update is now in place.
The error was due to manual intervention on our part.
The update is now in place.
Back Issues
You can now view back issues at the Daily Trading Diary Archives.
You can now view back issues at the Daily Trading Diary Archives.
Back Issues
Access the Trading Diary Archives.

Author: Colin Twiggs is a former investment banker with almost 40 years of experience in financial markets. He co-founded Incredible Charts and writes the popular Trading Diary and Patient Investor newsletters.
Using a top-down approach, Colin identifies key macro trends in the global economy before evaluating selected opportunities using a combination of fundamental and technical analysis.
Focusing on interest rates and financial market liquidity as primary drivers of the economic cycle, he warned of the 2008/2009 and 2020 bear markets well ahead of actual events.
He founded PVT Capital (AFSL No. 546090) in May 2023, which offers investment strategy and advice to wholesale clients.