|
Daylight Saving ASX As of 26 October 2003, Daylight Saving started in New South Wales, Victoria, South Australia and the ACT. Market hours remain unchanged in these States but will commence one hour earlier in all other States. NYSE/Nasdaq As of 26 October 2003, Daylight Saving ended in New York. NYSE/Nasdaq market hours (and updates) commence 2 hours later in New South Wales, Victoria, South Australia and the ACT and one hour later in all other States. |
Trading Diary
October 27, 2003
These extracts from my daily trading diary
are for educational purposes
and should not be interpreted as investment
advice. Full terms and conditions can be found at Terms
of Use .
USA
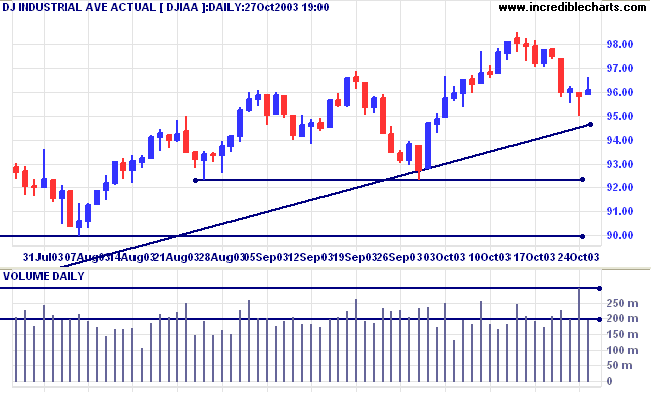
The Dow Industrial Average is consolidating above the long-term
trendline, closing at 9608 on low volume.
The intermediate trend is down.
The primary trend is up. A fall below 9000 will signal reversal.
The intermediate trend is down.
The primary trend is up. A fall below 9000 will signal reversal.
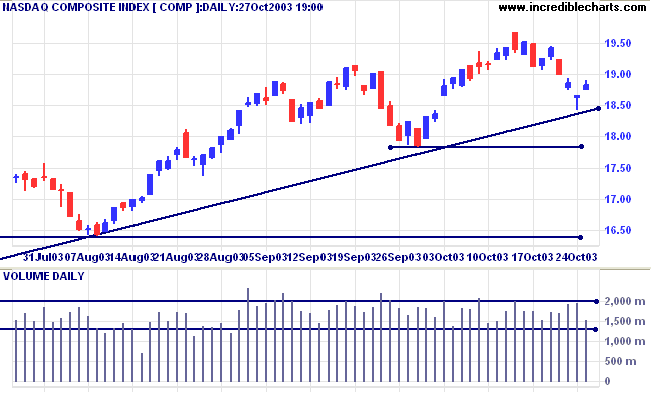
The Nasdaq Composite closed 17 points higher at 1883 on lower
volume, holding above the trendline.
The intermediate trend is down. Expect support at 1783.
The primary trend is up. A fall below 1640 will signal reversal.
The intermediate trend is down. Expect support at 1783.
The primary trend is up. A fall below 1640 will signal reversal.
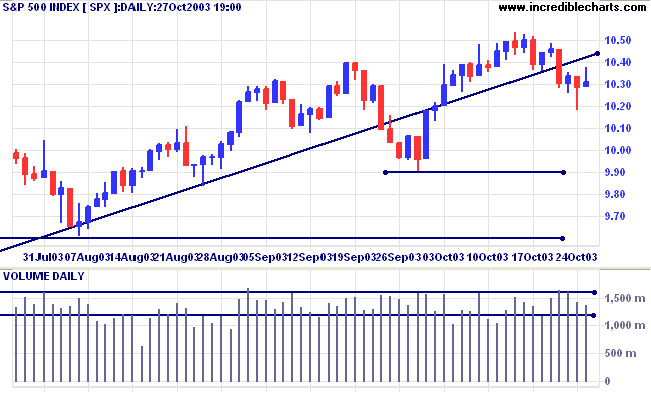
The S&P 500 is also consolidating, closing 2 points up at
1031 on lower volume.
The intermediate trend is down.
The primary trend is up. A fall below 960 will signal reversal.
The intermediate trend is down.
The primary trend is up. A fall below 960 will signal reversal.
The Chartcraft NYSE Bullish % Indicator rallied
to 80.60% (October 27).
Market Strategy
Short-term: Bullish if the S&P500 is above 1054. Bearish below 1026.
Intermediate: Bullish above 1054.
Long-term: Bullish above 960.
Short-term: Bullish if the S&P500 is above 1054. Bearish below 1026.
Intermediate: Bullish above 1054.
Long-term: Bullish above 960.
Fed meeting
The Fed is set to meet Tuesday but is expected to leave rates unchanged. (more)
The Fed is set to meet Tuesday but is expected to leave rates unchanged. (more)
Treasury yields
The yield on 10-year treasury notes rallied slightly to 4.26%.
The intermediate trend is down.
The primary trend is up.
The yield on 10-year treasury notes rallied slightly to 4.26%.
The intermediate trend is down.
The primary trend is up.
Gold
New York (17:32): Spot gold eased slightly to $387.20.
The intermediate trend is up.
The primary trend is up. Expect resistance at 400 to 415.
New York (17:32): Spot gold eased slightly to $387.20.
The intermediate trend is up.
The primary trend is up. Expect resistance at 400 to 415.
ASX Australia
The All Ordinaries closed 11 points lower at 3255 on average
volume. Initial support is at 3238 to 3250.
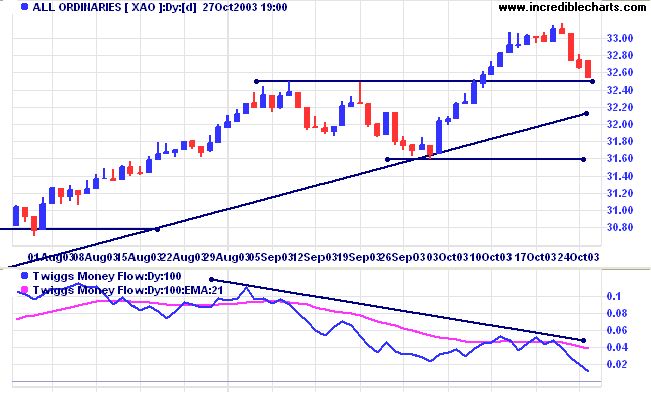
The intermediate up-trend is weak.
The primary trend is up. The rally is extended and the probability of a reversal increases with each successive primary trend movement.
A fall below 3160 will signal reversal.
MACD (26,12,9) is below its signal line; Slow Stochastic (20,3,3) is below; Twiggs Money Flow (100) is below its signal line and displays a bearish "triple" divergence.
Market Strategy
Short-term: Bullish if the All Ords is above 3317. Bearish below 3238.
Intermediate: Bullish above 3317.
Long-term: Bullish above 3160.
Short-term: Bullish if the All Ords is above 3317. Bearish below 3238.
Intermediate: Bullish above 3317.
Long-term: Bullish above 3160.
Banks
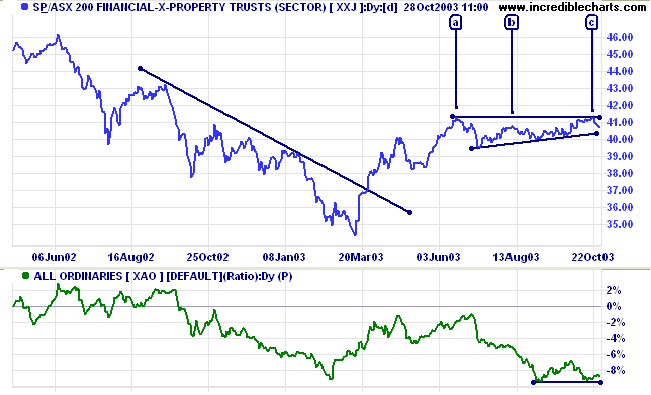
The Financials-X-Property index [XXJ] has consolidated over the period from [a] to [c]. This is not really an ascending triangle because of the lower high at [b]. Relative Strength has fallen markedly over this period but now appears to have formed equal lows in the past 2 months. A fall of RS below the recent lows will be a bear signal; a rise above the October high will be bullish.
The Financials-X-Property index [XXJ] has consolidated over the period from [a] to [c]. This is not really an ascending triangle because of the lower high at [b]. Relative Strength has fallen markedly over this period but now appears to have formed equal lows in the past 2 months. A fall of RS below the recent lows will be a bear signal; a rise above the October high will be bullish.
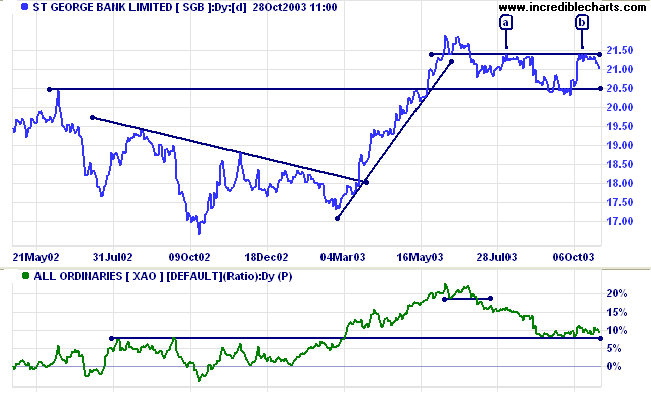
St George Bank [SGB] was last covered July 29, 2003. One of the best performers in
the sector, SGB has formed bearish equal highs at [a] and [b],
below the previous high in June. Relative Strength (xao) has
consolidated after a significant fall. A fall of RS below this
support level will be a strong bear signal.
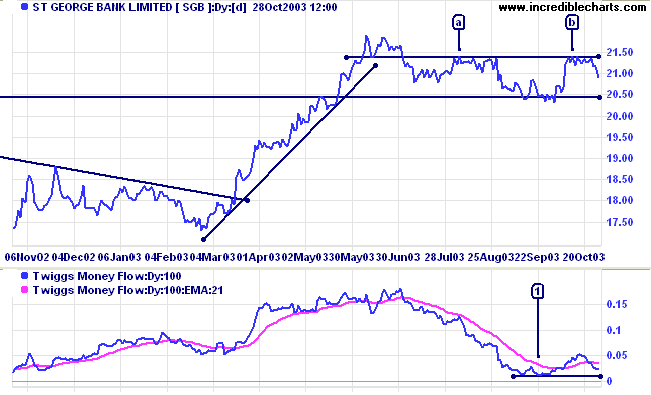
Twiggs Money Flow (100) is declining. A fall below the low of [1]
will be a further bear signal.
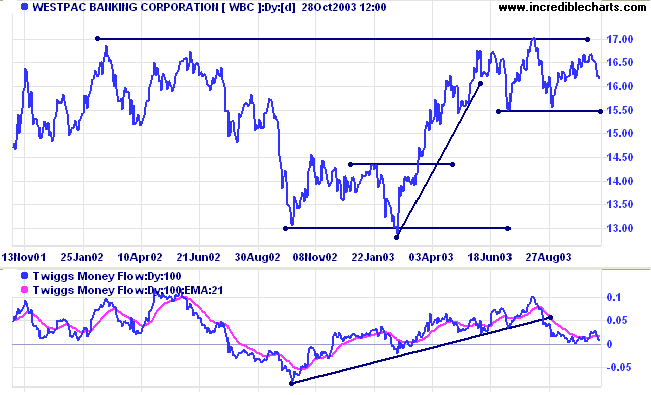
Westpac [WBC] was last covered October 16, 2003. Price threatens to form a
head and shoulders reversal pattern if there is a fall below
the neckline at 15.50. Twiggs Money Flow (100) signals weakness,
while Relative Strength is declining.
Understanding
the Trading Diary has been expanded to offer further
assistance to readers, including
directions on how to search the archives.
Colin Twiggs
An edge is nothing more than an indication of a
higher probability of one thing happening over another.
~ Mark Douglas: Trading in the Zone.
~ Mark Douglas: Trading in the Zone.
Cross-hairs
Some traders use cross-hairs to line up bars on a chart, or to check the date or price level:
(1) Select View >> Crosshair Cursor on the main menu.
(2) Click and hold the mouse pointer at the desired location and cross-hairs will appear.
If you have used Zoom on a chart, depress the ALT key before using the Crosshairs.
Back Issues
You can now view back issues at the Daily Trading Diary Archives.
You can now view back issues at the Daily Trading Diary Archives.
Back Issues
Access the Trading Diary Archives.

Author: Colin Twiggs is a former investment banker with almost 40 years of experience in financial markets. He co-founded Incredible Charts and writes the popular Trading Diary and Patient Investor newsletters.
Using a top-down approach, Colin identifies key macro trends in the global economy before evaluating selected opportunities using a combination of fundamental and technical analysis.
Focusing on interest rates and financial market liquidity as primary drivers of the economic cycle, he warned of the 2008/2009 and 2020 bear markets well ahead of actual events.
He founded PVT Capital (AFSL No. 546090) in May 2023, which offers investment strategy and advice to wholesale clients.