| Searching the Trading Diary Archives |
Use the normal Search function at the top
of the website page:
EXAMPLE |
Trading Diary
July 29, 2003
The Dow retreated to close 0.7% lower at 9204 on higher volume.
The intermediate trend is up. A decline below 9000 will signal a down-turn.
The primary trend is up.
The intermediate trend is up. A fall below 976 will signal a down-turn.
The primary trend is up.
The intermediate trend is up.
The primary trend is up.
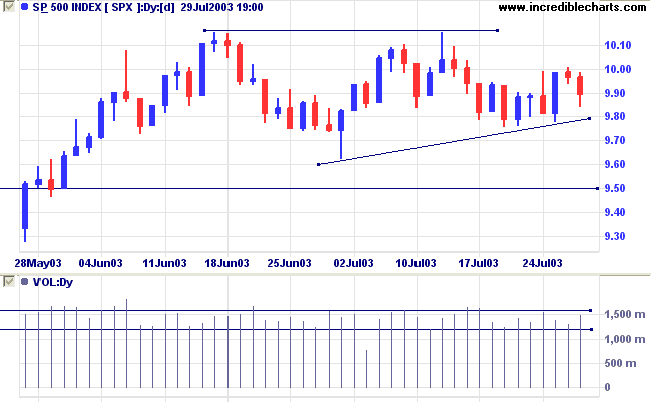
Intermediate: Long if the S&P is above 1015. Short if below 962.
Long-term: Long if above 962.
The Conference Board consumer confidence index surprised forecasters with a drop to 76.6 from 83.5 in June. (more)
CBOE: The yield on 10-year notes has jumped to 4.40%.
The intermediate trend is up; the primary trend has reversed upwards.
New York (19.21): Spot gold eased to $US 361.20.
On the five-year chart, gold is above the long-term upward trendline.
The intermediate trend is up. A break below support at 3089 would be bearish.
The primary trend is up.
MACD (26,12,9) is above its signal line; Slow Stochastic (20,3,3) is above; Twiggs Money Flow (21) signals accumulation.
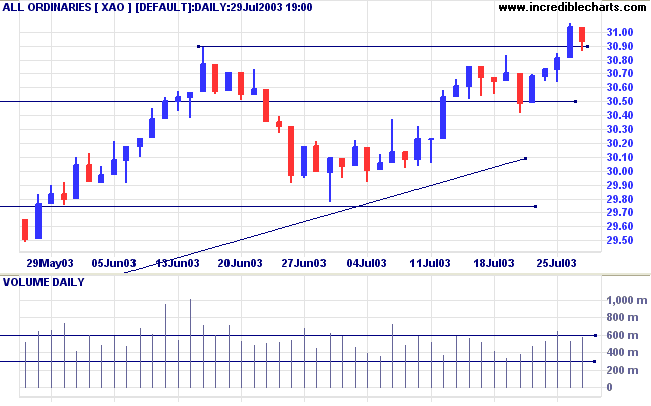
Intermediate: The primary trend is up; Long if the All Ords is above 3089. Short if below 2978.
Long-term: Long if the index is above 2978.
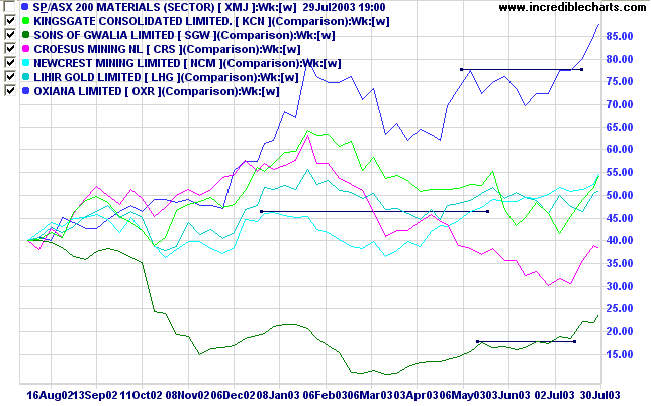
Last covered on November 13, 2002.
A sector chart of major gold stocks shows several making new 3-month highs:
St George Bank [SGB]
SGB displays rising relative strength (price ratio: xao) over the past 3 years. Price recently made a new high but has since pulled back to test support at the previous high point.
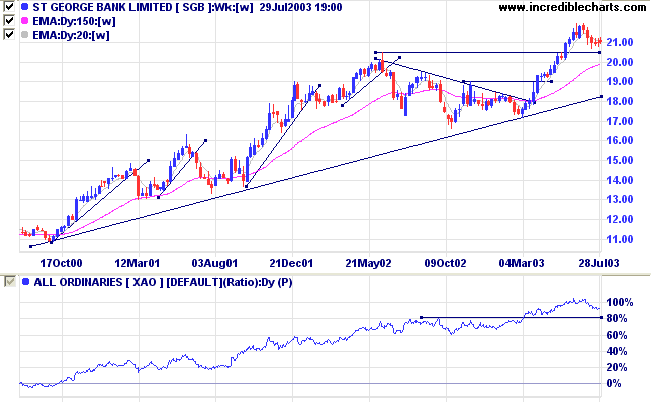
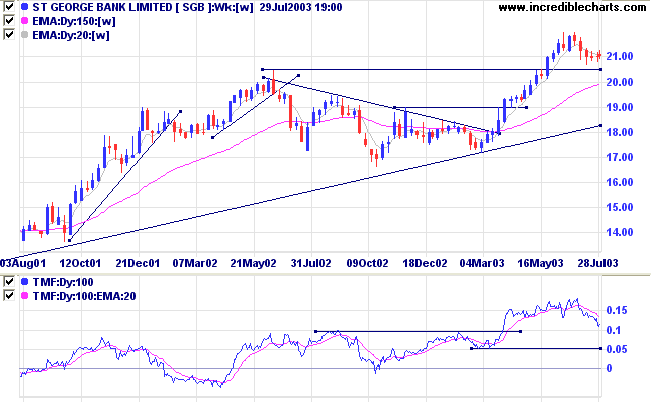
MACD appears set to make a bullish up-turn just below the zero line (the lines have not yet crossed so this is not yet a valid signal).
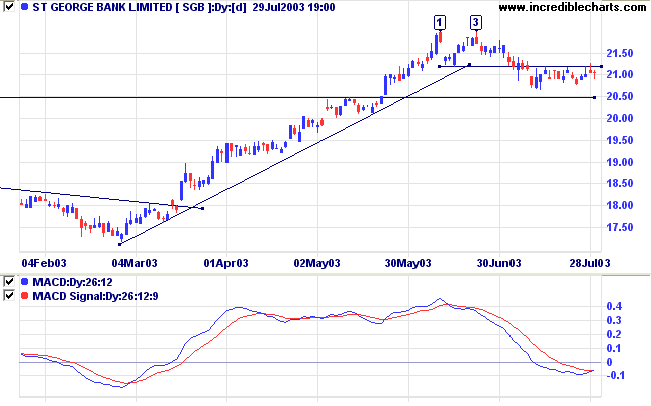
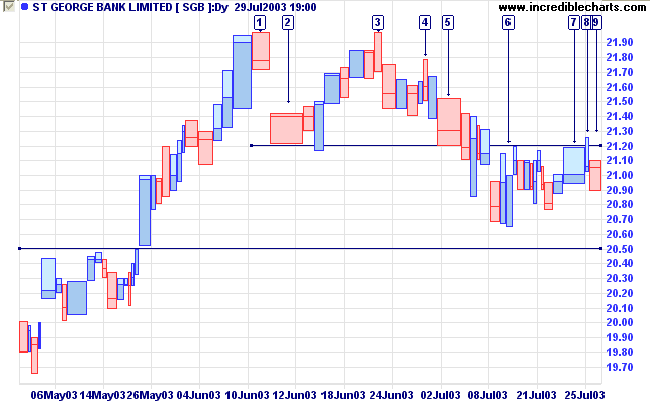
A close below support at 20.50 would be a strong bear signal.
Another rule is, when doubtful reduce the amount of the interest;
for either the mind is not satisfied with the position taken, or the interest is too large for safety.
One man told another that he could not sleep on account of his position in the market;
his friend judiciously and laconically replied: "Sell down to a sleeping point".
~ S.A. Nelson: The ABC of Stock Speculation (1903).
| Stock Screens: Trend Reversals |
|
Directional movement
is also used to identify trend
reversals: |
You can now view back issues at the Daily Trading Diary Archives.
Back Issues

Author: Colin Twiggs is a former investment banker with almost 40 years of experience in financial markets. He co-founded Incredible Charts and writes the popular Trading Diary and Patient Investor newsletters.
Using a top-down approach, Colin identifies key macro trends in the global economy before evaluating selected opportunities using a combination of fundamental and technical analysis.
Focusing on interest rates and financial market liquidity as primary drivers of the economic cycle, he warned of the 2008/2009 and 2020 bear markets well ahead of actual events.
He founded PVT Capital (AFSL No. 546090) in May 2023, which offers investment strategy and advice to wholesale clients.