Any Psychologists on
Board?
If you have a spare hour, there is an excellent discussion on the Chart Forum
on day trading and swing trading tactics.
If you have a spare hour, there is an excellent discussion on the Chart Forum
on day trading and swing trading tactics.
Trading Diary
June 26, 2003
These extracts from my daily trading diary are
intended to illustrate the techniques used in short-term trading
and should not be interpreted as investment advice. Full terms
and conditions can be found at Terms
of Use .
USA
The Dow formed an inside day, signaling uncertainty. The index closed 0.7% up at 9079 on lower volume; above the 9000 support level.
The intermediate trend is up.
The primary up-trend is up.
The Dow formed an inside day, signaling uncertainty. The index closed 0.7% up at 9079 on lower volume; above the 9000 support level.
The intermediate trend is up.
The primary up-trend is up.
The S&P 500 rallied 10 points to close at 985.
The intermediate trend is up. The index may be forming equal lows (the first low on June 9); a bullish sign in an up-trend.
The primary trend is up.
The intermediate trend is up. The index may be forming equal lows (the first low on June 9); a bullish sign in an up-trend.
The primary trend is up.
The Nasdaq Composite rallied 2.0% to close at 1634.
The intermediate trend is up. Equal lows on the 9th and 24th of June are a bullish sign.
The primary trend is up.
The intermediate trend is up. Equal lows on the 9th and 24th of June are a bullish sign.
The primary trend is up.
The Chartcraft NYSE Bullish % Indicator is 0.86%
from its peak, at 74.36% on June 25.
Market Strategy
Short-term: Long if the S&P 500 is above 986 (the day's
high).
Intermediate: Long if the S&P is above 992.
Long-term: Long.
Intermediate: Long if the S&P is above 992.
Long-term: Long.
Jobless claims fall
New claims for unemployment benefits last week fell to a 3-month low of 404,000. (more)
New claims for unemployment benefits last week fell to a 3-month low of 404,000. (more)
Is the Fed running out of
ammunition?
The current one per cent overnight rate does not leave the Fed with much leeway if the economy does not respond. (more)
The current one per cent overnight rate does not leave the Fed with much leeway if the economy does not respond. (more)
Gold
New York (17.10): Spot gold has fallen to $US 343.90.
On the five-year chart gold is above the long-term upward trendline.
New York (17.10): Spot gold has fallen to $US 343.90.
On the five-year chart gold is above the long-term upward trendline.
ASX Australia
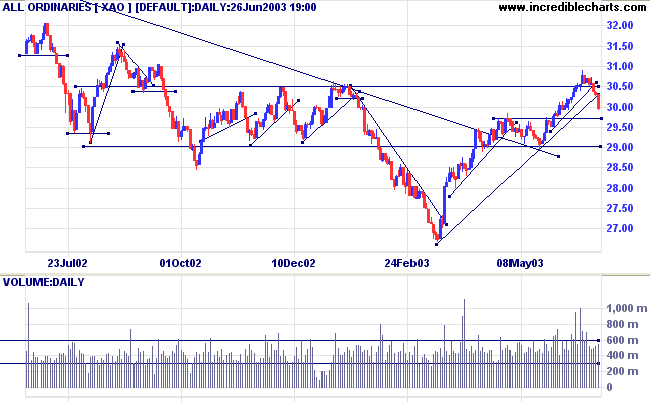
I have been surprised by the severity of the correction, with the
All Ordinaries closing sharply lower at 2997 on higher volume,
breaking the primary supporting trendline.
The intermediate trend is down.
The primary trend is up. If price holds above support at 2970 this will indicate that the up-trend is still strong. A fall to 2900 will signal weakness.
The monthly Coppock indicator has turned up below zero, signaling the start of a bull market.
Twiggs Money Flow (100) signals accumulation.
MACD (26,12,9) is below its signal line; Slow Stochastic (20,3,3) is below; Twiggs Money Flow (21) signals accumulation.
Market Strategy
Short-term: Long if the All Ords is above 3032 (Wednesday's
high).
Intermediate: The primary trend has reversed up; Long if the All Ords is above 3050.
Long-term: The primary trend reversal has confirmed the March 18 follow through signal. Long.
Intermediate: The primary trend has reversed up; Long if the All Ords is above 3050.
Long-term: The primary trend reversal has confirmed the March 18 follow through signal. Long.
Double Tops
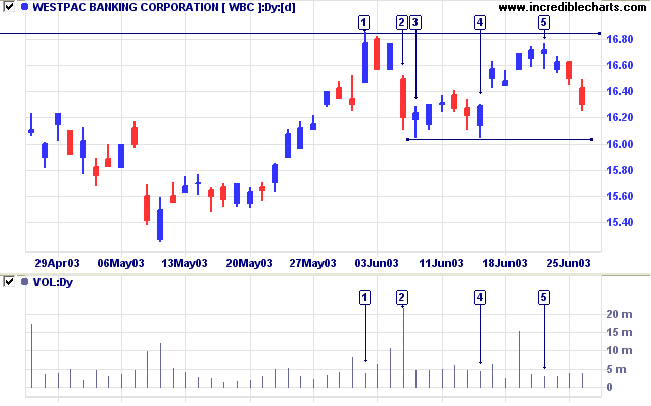
Both Westpac [WBC] and St George [SGB] have completed similar equal highs in the last two weeks.
Westpac formed a new high at resistance at [1], but on moderate volume.
The correction at [2] was accompanied by strong volume which then dried up at [3].
Price then re-tested the low at [4] before a weak rally to [5].
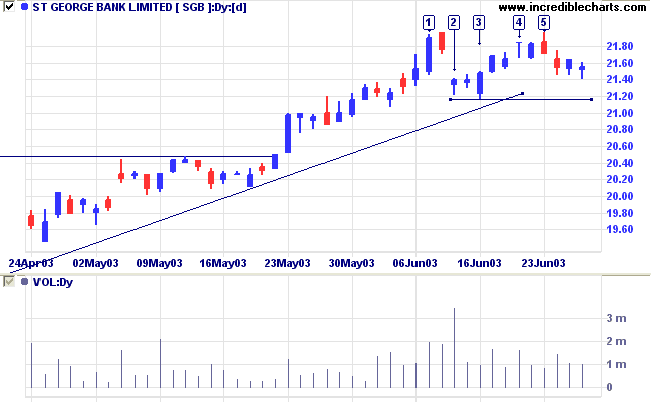
St George made a new high (a few days after WBC) at [1].
It then followed a similar pattern: gapping down on strong volume at [2]; re-testing the low at [3]; before a weak rally to [4].
Volume dropped off at [5] and SGB has again retreated.
It then followed a similar pattern: gapping down on strong volume at [2]; re-testing the low at [3]; before a weak rally to [4].
Volume dropped off at [5] and SGB has again retreated.
Equal highs in an up-trend are not a strong signal unless they
complete a double top pattern, with a break below the intervening
trough. Most resolve into ascending triangle patterns, and end
with a continuation of the up-trend.
Westpac: A break below 16.04 would be bearish; a rise above 16.85 bullish.
St George: A break below 21.16 would be bearish; a rise above 22.00 bullish.
Westpac: A break below 16.04 would be bearish; a rise above 16.85 bullish.
St George: A break below 21.16 would be bearish; a rise above 22.00 bullish.
Understanding
the Trading Diary has been expanded to offer further
assistance to readers.
Colin Twiggs
It is said an Eastern monarch once charged his wise men
to invent him a sentence to be ever in view,
and which should be true and appropriate in all times and situations.
They presented him the words: 'And this, too, shall pass away.'
How much it expresses! How chastening in the hour of pride!
How consoling in the depths of affliction!
~ Abraham Lincoln: September 1859.
Volume Moving Average
Select File >> Advanced Features >> Advanced Indicator Smoothing
to plot moving averages on volume and other indicators.
Use the Indicator Panel to set the moving averages.
Select File >> Advanced Features >> Advanced Indicator Smoothing
to plot moving averages on volume and other indicators.
Use the Indicator Panel to set the moving averages.
Back Issues
Click here to access the Daily Trading Diary Archives.
Click here to access the Daily Trading Diary Archives.
Back Issues
Access the Trading Diary Archives.

Author: Colin Twiggs is a former investment banker with almost 40 years of experience in financial markets. He co-founded Incredible Charts and writes the popular Trading Diary and Patient Investor newsletters.
Using a top-down approach, Colin identifies key macro trends in the global economy before evaluating selected opportunities using a combination of fundamental and technical analysis.
Focusing on interest rates and financial market liquidity as primary drivers of the economic cycle, he warned of the 2008/2009 and 2020 bear markets well ahead of actual events.
He founded PVT Capital (AFSL No. 546090) in May 2023, which offers investment strategy and advice to wholesale clients.