|
US Data NYSE, Nasdaq and Amex stocks. Upgrade of the server may delay us by a day or two. |
Trading Diary
November 6, 2003
These extracts from my daily trading diary
are for educational purposes
and should not be interpreted as investment
advice. Full terms and conditions can be found at Terms
of Use .
USA
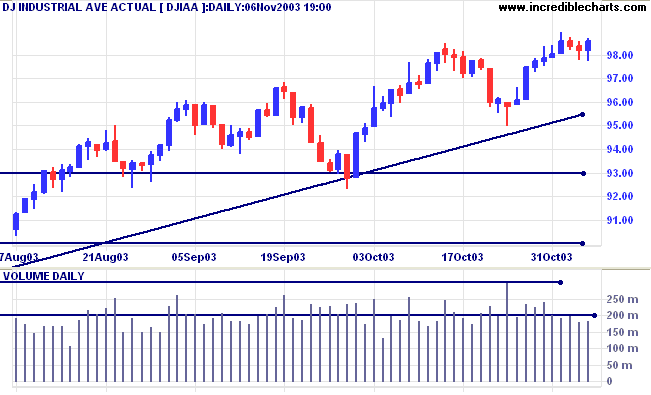
The Dow Industrial Average formed an outside day, closing up at
9857. Low volume signals a lack of enthusiasm from buyers and
sellers.
The intermediate trend is up.
The primary trend is up. A fall below 9000 will signal reversal.
The intermediate trend is up.
The primary trend is up. A fall below 9000 will signal reversal.
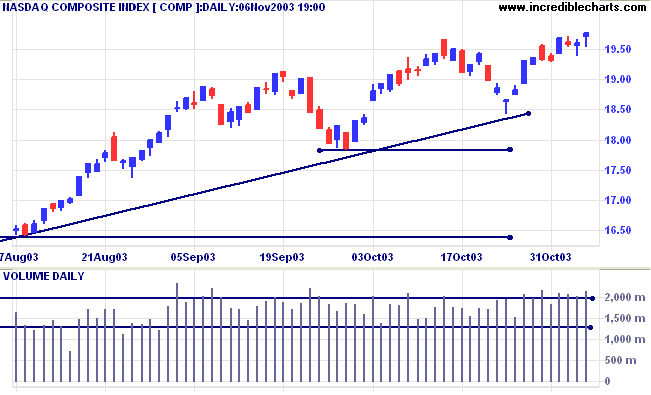
The Nasdaq Composite formed a bearish hanging
man on strong volume, closing up 17 points at 1976.
The intermediate trend is up.
The primary trend is up, approaching resistance at 2000. A fall below 1640 would signal reversal.
The intermediate trend is up.
The primary trend is up, approaching resistance at 2000. A fall below 1640 would signal reversal.
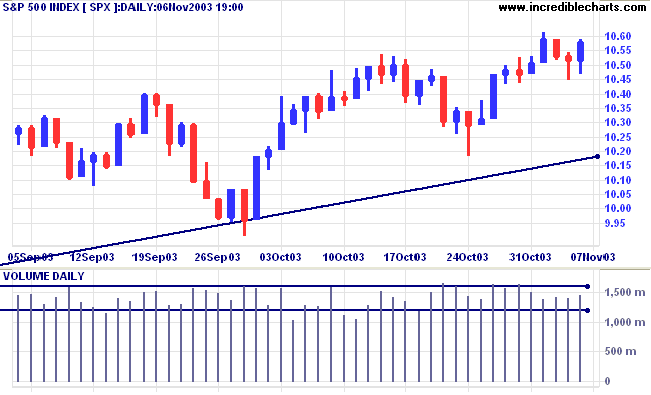
The S&P 500 rallied 6 points to close at 1058 on higher
volume.
The intermediate trend is up.
The primary trend is up. A fall below 960 will signal reversal.
The intermediate trend is up.
The primary trend is up. A fall below 960 will signal reversal.
The Chartcraft NYSE Bullish % Indicator weakened
slightly to 81.47% (November 6).
Market Strategy
Short-term: Bullish if the S&P500 is above 1055.
Intermediate: Bullish above 1055.
Long-term: Bullish above 960.
Short-term: Bullish if the S&P500 is above 1055.
Intermediate: Bullish above 1055.
Long-term: Bullish above 960.
Jobless claims fall
New unemployment claims fell to 348,000 last week, the lowest level since January 2001. (more)
New unemployment claims fell to 348,000 last week, the lowest level since January 2001. (more)
Treasury yields
The yield on 10-year treasury notes rallied to 4.45%, reversing the intermediate trend (upwards).
The primary trend is up.
The yield on 10-year treasury notes rallied to 4.45%, reversing the intermediate trend (upwards).
The primary trend is up.
Gold
New York (18.56): Spot gold eased to $379.70.
The intermediate trend is up. Price has formed equal highs in the past 6 weeks; a fall below 370.00 will be a bear signal.
The primary trend is up. Expect resistance at 400 to 415.
New York (18.56): Spot gold eased to $379.70.
The intermediate trend is up. Price has formed equal highs in the past 6 weeks; a fall below 370.00 will be a bear signal.
The primary trend is up. Expect resistance at 400 to 415.
ASX Australia
The All Ordinaries made another test of the 3250 support level,
before closing back above at 3258. Higher volume and a weak close
signal continued buying support. A rally from above the initial
support level will signal trend strength.
A reader posed the question: How does one interpret the weak close on higher volume as "buyer support" rather than sellers' lack of confidence? When we see large volume on a small range one can assume buyers are keen at the price but large volume opening on the high and closing on the low suggests to me that the bears won out forcing prices down and reflecting a lack of confidence (hence the volume).
Answer: If price moves lower, this signals that sellers are in control and driving price lower. But if the Close is weak, it indicates that buyers have entered the fray in sufficient numbers to drive price back up to near the middle of the daily range. Increased volume and the close above the 3250 support level are further evidence of buying support.
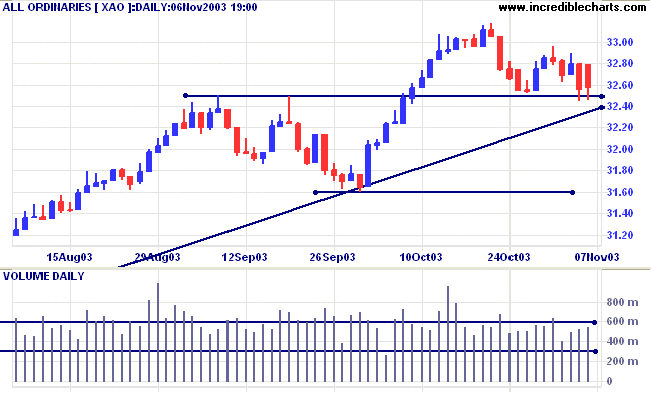
The intermediate trend is down, with a band of support between
3238 and 3250.
The primary trend is up. The rally is extended and probability of a reversal increases with each successive primary trend movement. A fall below 3160 will signal reversal.
MACD (26,12,9) is below its signal line; Slow Stochastic (20,3,3) is below; Twiggs Money Flow (100) is below its signal line and displays a bearish "triple" divergence.
Market Strategy
Short-term: Bullish if the All Ords is above 3296. Bearish below 3238.
Intermediate: Bullish above 3296.
Long-term: Bullish above 3160.
Short-term: Bullish if the All Ords is above 3296. Bearish below 3238.
Intermediate: Bullish above 3296.
Long-term: Bullish above 3160.
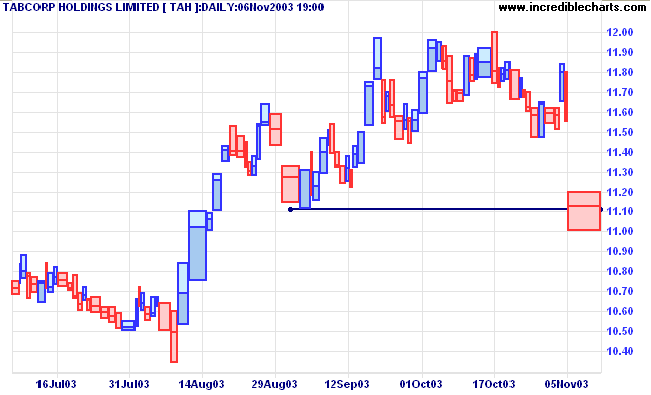
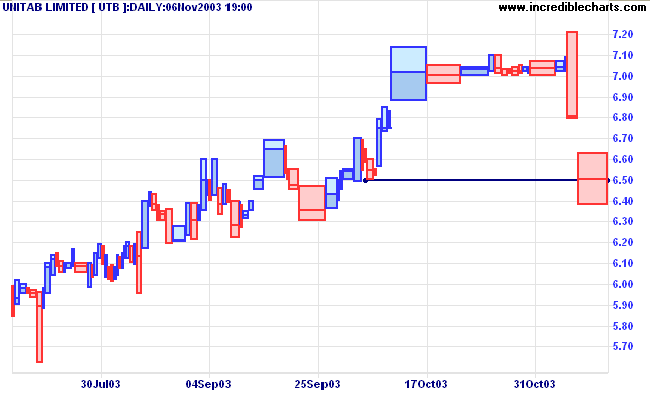
Tabcorp, Tab and Unitab
There was mixed reaction to Tabcorp's offer for TAB. The TAH proposal appears more attractive than the earlier Unitab [UTB] offer, but is likely to face legislative hurdles and a challenge from the competition watchdog. (more)
There was mixed reaction to Tabcorp's offer for TAB. The TAH proposal appears more attractive than the earlier Unitab [UTB] offer, but is likely to face legislative hurdles and a challenge from the competition watchdog. (more)
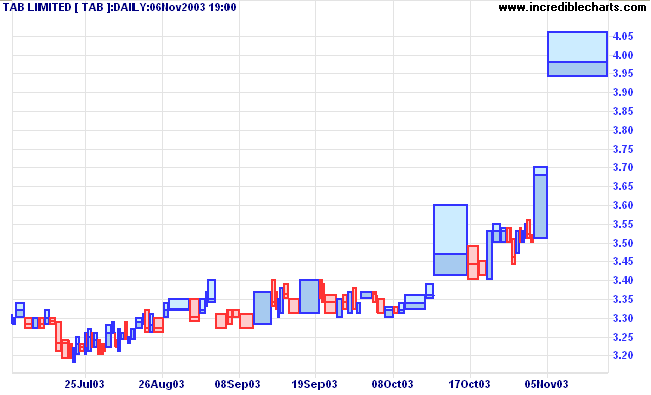
The market has sensibly downgraded TAH and UTB, in expectation of
a bidding war. Management egos play a role in most takeovers.
St George Bank [SGB]
Last covered yesterday November 5, 2003.
SGB broke through support after strong bear signals on Relative Strength (xao) and Twiggs Money Flow (100).
Last covered yesterday November 5, 2003.
SGB broke through support after strong bear signals on Relative Strength (xao) and Twiggs Money Flow (100).
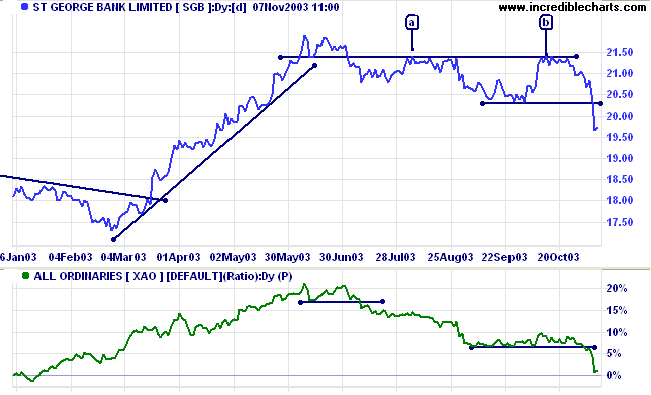
I am wary of shorting stocks when the overall market is still in
an up-trend. SGB has given strong bear signals but it would be
prudent to wait for the pull-back and not take any position on
the initial breakout.
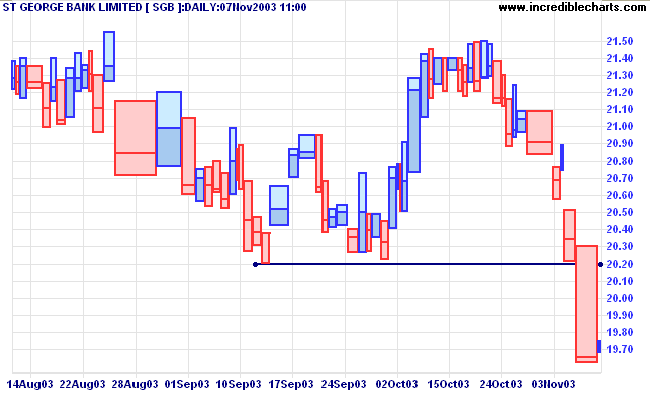
Signs to look for on a pull-back are:
- a short duration (ideally not more than 3 days);
- volume dries up;
- volatility (daily range) dries up; and
- price respects the new resistance level.
Understanding
the Trading Diary has been expanded to offer further
assistance to readers, including
directions on how to search the archives.
Colin Twiggs
I don't mind making mistakes,
what I don't like is being wrong.
~ Jesse Livermore in Reminiscences of a Stock Operator,
by Edwin Lefevre (1923).
(We all make mistakes, but you need to analyze them and modify your behavior to avoid repeating them.)
what I don't like is being wrong.
~ Jesse Livermore in Reminiscences of a Stock Operator,
by Edwin Lefevre (1923).
(We all make mistakes, but you need to analyze them and modify your behavior to avoid repeating them.)
Refresh Current Security from Server
| If ever an update is delayed, or you suspect that you do not have the latest data, use the above command on the Securities menu to refresh the chart from the server. |
Back Issues
You can now view back issues at the Daily Trading Diary Archives.
You can now view back issues at the Daily Trading Diary Archives.
Back Issues
Access the Trading Diary Archives.

Author: Colin Twiggs is a former investment banker with almost 40 years of experience in financial markets. He co-founded Incredible Charts and writes the popular Trading Diary and Patient Investor newsletters.
Using a top-down approach, Colin identifies key macro trends in the global economy before evaluating selected opportunities using a combination of fundamental and technical analysis.
Focusing on interest rates and financial market liquidity as primary drivers of the economic cycle, he warned of the 2008/2009 and 2020 bear markets well ahead of actual events.
He founded PVT Capital (AFSL No. 546090) in May 2023, which offers investment strategy and advice to wholesale clients.