|
Incredible Charts version
4.0.2.600 The new version contains some adjustments necessary for the loading of ETOs and Warrants: members who had selected Time Period >> Chart 3 Years Data [Quicker], were receiving 404 errors - file not found. See What's New for details. Check Help >> About to ensure that you have received the automatic update. |
Trading Diary
October 20, 2003
These extracts from my daily trading diary
are for educational purposes
and should not be interpreted as investment
advice. Full terms and conditions can be found at Terms
of Use .
USA
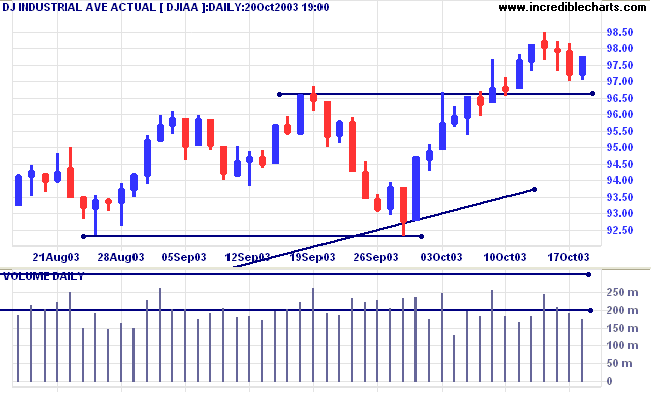
The Dow Industrial Average formed an inside day, signaling
support above 9660. The index closed up at 9778 on low
volume.
The intermediate trend is up. An up-turn above 9660 will signal trend strength.
The primary trend is up. A fall below 9000 will signal reversal.
The intermediate trend is up. An up-turn above 9660 will signal trend strength.
The primary trend is up. A fall below 9000 will signal reversal.
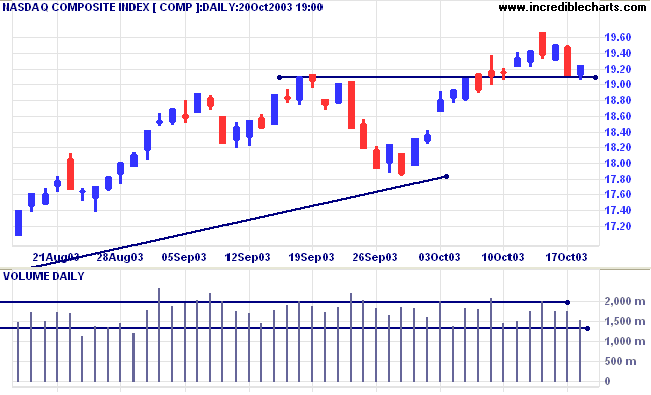
The Nasdaq Composite formed a weak reversal with low volume,
closing up 15 points at 1925 on lower volume after testing
support at 1910.
The intermediate trend is up.
The primary trend is up. A fall below 1640 will signal reversal.
The intermediate trend is up.
The primary trend is up. A fall below 1640 will signal reversal.
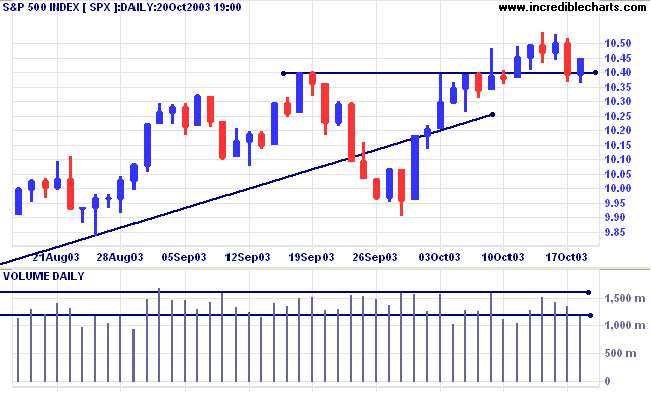
The S&P 500 rallied 6 points to close at 1045 on low
volume.
The intermediate trend is up.
The primary trend is up. A fall below 960 will signal reversal.
The intermediate trend is up.
The primary trend is up. A fall below 960 will signal reversal.
The Chartcraft NYSE Bullish % Indicator eased
further to 81.62% ( October 20).
Market Strategy
Short-term: Bullish if the S&P500 is above 1045.
Intermediate: Bullish above 1045.
Long-term: Bullish above 960.
Short-term: Bullish if the S&P500 is above 1045.
Intermediate: Bullish above 1045.
Long-term: Bullish above 960.
Leading indicators mixed
Economists received mixed signals from leading indicators for September. (more)
Economists received mixed signals from leading indicators for September. (more)
Treasury yields
The yield on 10-year treasury notes eased to 4.38%.
The intermediate trend is up. Expect resistance at 4.60%.
The primary trend is up.
The yield on 10-year treasury notes eased to 4.38%.
The intermediate trend is up. Expect resistance at 4.60%.
The primary trend is up.
Gold
New York (13.30): Spot gold is up slightly at $373.50.
The intermediate trend is down.
The primary trend is up, with support at 343 to 350.
New York (13.30): Spot gold is up slightly at $373.50.
The intermediate trend is down.
The primary trend is up, with support at 343 to 350.
ASX Australia
The All Ordinaries displays an absence of buyers, with a weak
close on lower volume; down 6 points at 3295 after an early
rally.
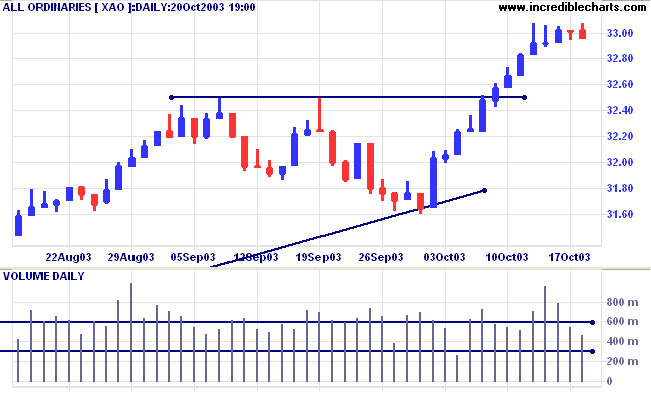
The intermediate trend is up.
The primary trend is up. A fall below 3160 will signal reversal.
MACD (26,12,9) is above its signal line; Slow Stochastic (20,3,3) has whipsawed above; Twiggs Money Flow (100) is below the signal line and displays a "triple" bearish divergence.
The primary trend is up. A fall below 3160 will signal reversal.
MACD (26,12,9) is above its signal line; Slow Stochastic (20,3,3) has whipsawed above; Twiggs Money Flow (100) is below the signal line and displays a "triple" bearish divergence.
Market Strategy
Short-term: Bullish if the All Ords is above 3307. Bearish below 3283.
Intermediate: Bullish above 3250.
Long-term: Bullish above 3160.
Short-term: Bullish if the All Ords is above 3307. Bearish below 3283.
Intermediate: Bullish above 3250.
Long-term: Bullish above 3160.
Publishing
A new sub-industry was highlighted by weekly stock screens:
A new sub-industry was highlighted by weekly stock screens:
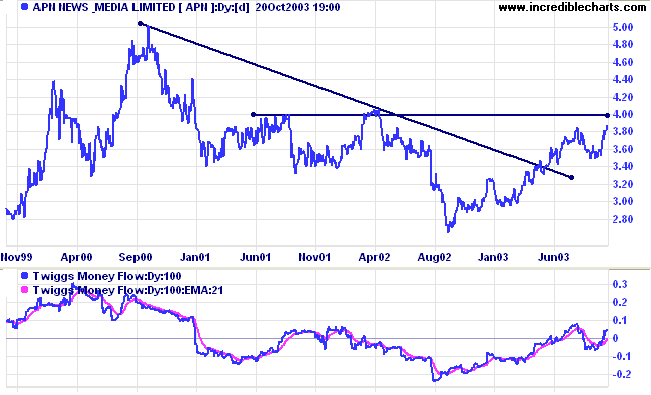
APN News Media [APN] faces strong overhead resistance at
4.00 after rallying off a V-bottom in late 2002.
Twiggs Money Flow (100) has risen above zero, signaling accumulation.
Twiggs Money Flow (100) has risen above zero, signaling accumulation.
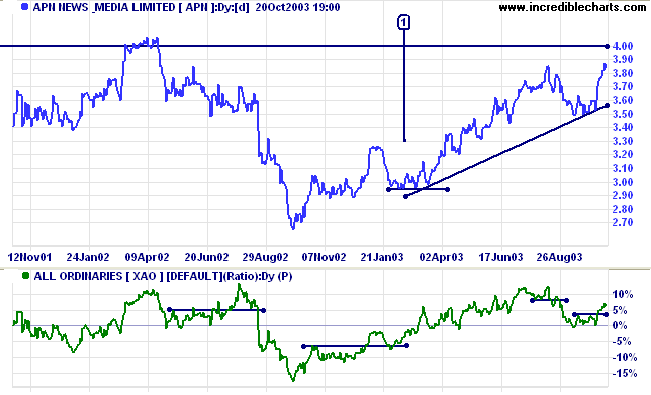
Closer examination of the V-bottom shows that a re-test of
support levels did take place at [1], encountering strong support
at 2.95 before resuming the rally.
Relative Strength (price ratio: xao) is recovering, after a secondary correction. Price is likely to encounter strong resistance at 4.00: there has been insufficient volume on the sell-off in 2002.
Relative Strength (price ratio: xao) is recovering, after a secondary correction. Price is likely to encounter strong resistance at 4.00: there has been insufficient volume on the sell-off in 2002.
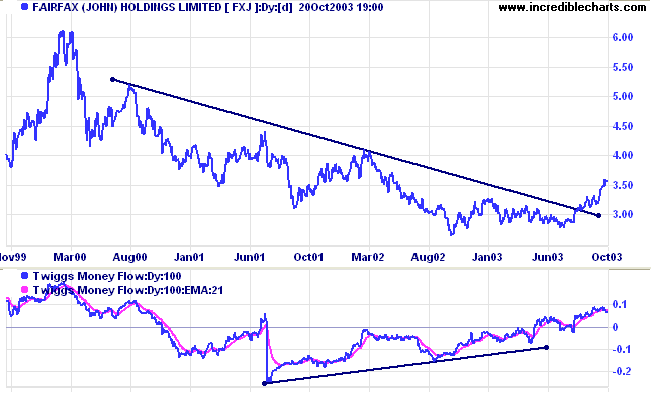
John Fairfax Holdings [FXJ], last covered May 28, 2003, formed a broad base in 2002 to
2003 accompanied by a strong bullish divergence on Twiggs Money
Flow (100).
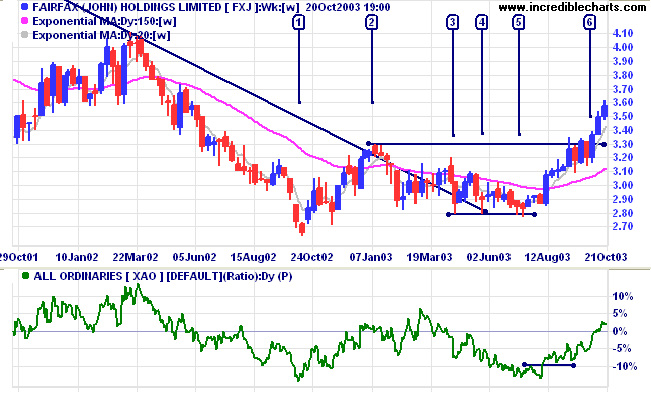
Price completed a primary trend reversal at [6], with a new high
after higher lows at [3],[4] and [5]. Relative Strength (price
ratio: xao) is rising strongly. Resistance at 4.00 to 4.10 is the
next target.
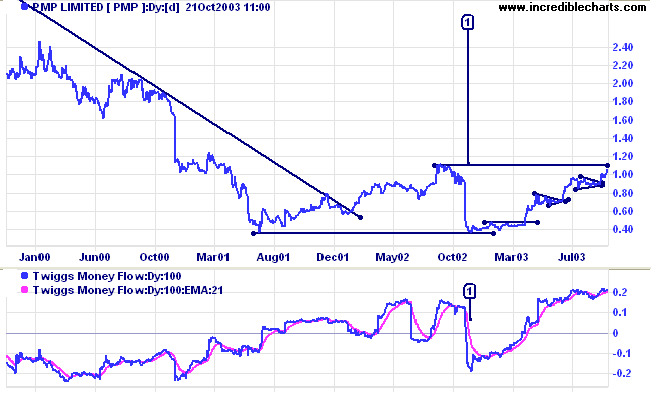
PMP Limited [PMP], last covered July 5, 2002, has formed a broad double
bottom over 2001/2002. The cathartic sell-off at [1] should
weaken resistance at 1.10. A large amount of stock has changed
hands at low prices; and buyers at low prices will be less
inclined to sell on a recovery to earlier highs.
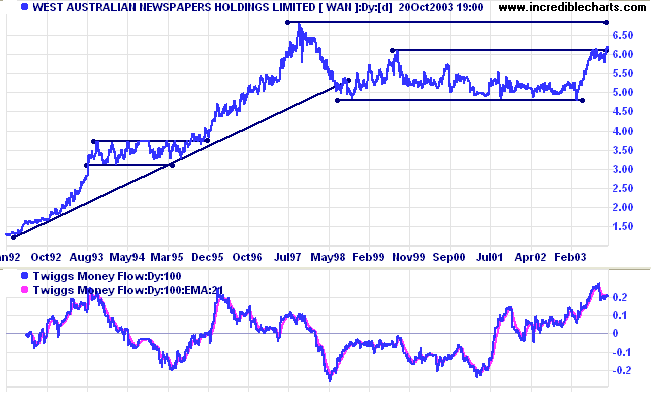
West Australian Newspapers [WAN], last covered April 30, 2003, formed a broad consolidation
above support at 4.80. Price recently rallied, to consolidate
below 6.10, before breaking through resistance.
Twiggs Money Flow (100) signals strong accumulation. The target is overhead resistance at 6.80.
Twiggs Money Flow (100) signals strong accumulation. The target is overhead resistance at 6.80.
The equivolume chart shows initial tests of resistance at [1],
[2] and [3] all retreated back below 6.10, signaling a lack of
buying support. This was followed by profit-taking at [4], with
heavy selling into the rally. The latest breakout shows stronger
support on the short-term pull-back at [5] but subsequent days
display thin volume and we may see further re-tests of the new
support level.
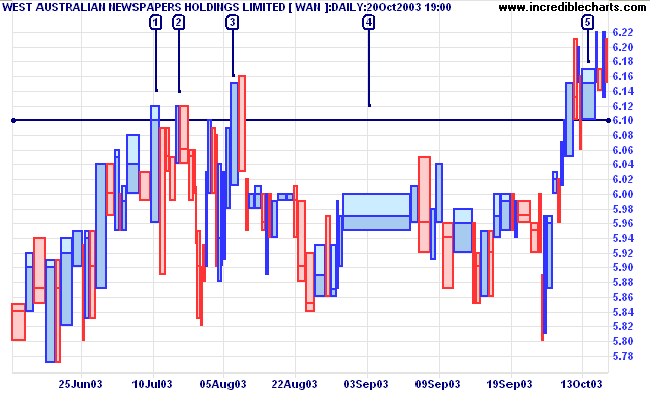
Prudent traders may wait for an intermediate-term pull-back to
respect support at 6.00 to 6.10 before increasing long positions.
A close below 5.80 would be a strong bear signal.
Understanding
the Trading Diary has been expanded to offer further
assistance to readers, including
directions on how to search the archives.
Colin Twiggs
A market which has been overbought becomes dull
on rallies and develops activity on declines;
conversely, when a market is oversold, the tendency is to become dull on declines and active on rallies.
Bull markets terminate in a period of excessive activity and begin with comparatively light transactions.
~ Robert Rhea: Dow Theory (1932).
conversely, when a market is oversold, the tendency is to become dull on declines and active on rallies.
Bull markets terminate in a period of excessive activity and begin with comparatively light transactions.
~ Robert Rhea: Dow Theory (1932).
Chart 3 Years Data
For faster loading, select Time Period >> Chart 3 Years Data.
The smaller files enable quicker loading.
To restore the complete data history,
select Time Period >> Chart Complete Data.
For faster loading, select Time Period >> Chart 3 Years Data.
The smaller files enable quicker loading.
To restore the complete data history,
select Time Period >> Chart Complete Data.
Back Issues
You can now view back issues at the Daily Trading Diary Archives.
You can now view back issues at the Daily Trading Diary Archives.
Back Issues
Access the Trading Diary Archives.

Author: Colin Twiggs is a former investment banker with almost 40 years of experience in financial markets. He co-founded Incredible Charts and writes the popular Trading Diary and Patient Investor newsletters.
Using a top-down approach, Colin identifies key macro trends in the global economy before evaluating selected opportunities using a combination of fundamental and technical analysis.
Focusing on interest rates and financial market liquidity as primary drivers of the economic cycle, he warned of the 2008/2009 and 2020 bear markets well ahead of actual events.
He founded PVT Capital (AFSL No. 546090) in May 2023, which offers investment strategy and advice to wholesale clients.