Subscribe by 31 May 2003.
The Daily Trading Diary will only be available to Premium members.
We have extended the cut-off until mid-May - to fit in with the introduction of US charts.
Trading Diary
April 30, 2003
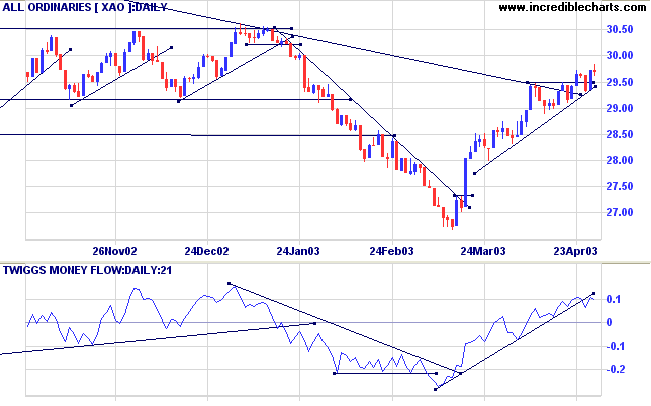
The intermediate trend is down. A rise above 8587 will signal the start of an up-trend; a fall below 8109 will signal continuation.
March 17th's follow through remains valid (as long as the index holds above 7763).
The primary trend is down; a rise above 9076 will signal a reversal.
The Nasdaq Composite lost 7 points to close at 1464.
The intermediate trend is up; overhead resistance is at 1521.
The primary trend is up.
The S&P 500 closed almost unchanged; 1 point down at 916.
The intermediate up-trend continues.
The primary trend is down; a rise above 954 will signal a reversal.
The Chartcraft NYSE Bullish % Indicator is rising after a Bull Correction buy signal; up almost 1% at 51.76% (April 29).
Long-term: There are already two bull signals: the March 17 follow through day and the NYSE Bullish % signal. Wait for confirmation from a Dow/S&P primary trend reversal.
Alan Greenspan tells Congress that he sees signs of recovery but warns that business caution and high unemployment may inhibit. (more)
New York (18.14): Spot gold rallied strongly to $US 339.10.
The intermediate up-trend continues.
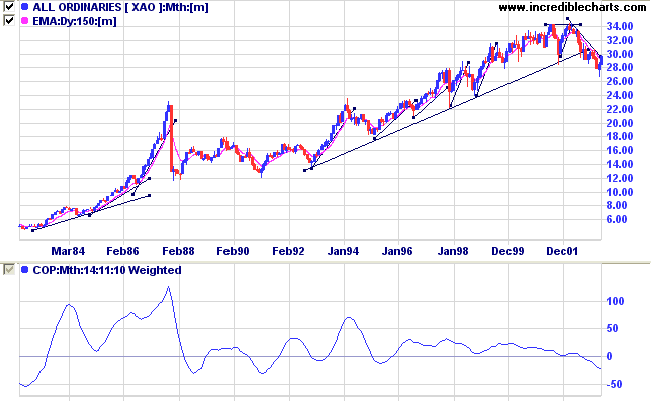
The primary trend is down, although the trendline has been broken; a rise above 3062 will signal a reversal.
MACD (26,12,9) is above its signal line; Slow Stochastic (20,3,3) is below; Twiggs Money Flow (21) has crossed below the upward trendline but continues to signal accumulation.
An up-turn below zero would signal the start of a bull market.
Long-term: There is already a bull signal: the March 18 follow through. Wait for confirmation from a primary trend reversal.
Consumer Discretionary sector, including several Media stocks, are showing signs of recovery.
WAN has formed a broad base after a stage 3 top in 1998. The stock formed a broad descending triangle but has held above support at 4.80.
Twiggs Money Flow (100-day) signals strong accumulation, especially from [c] to [g].
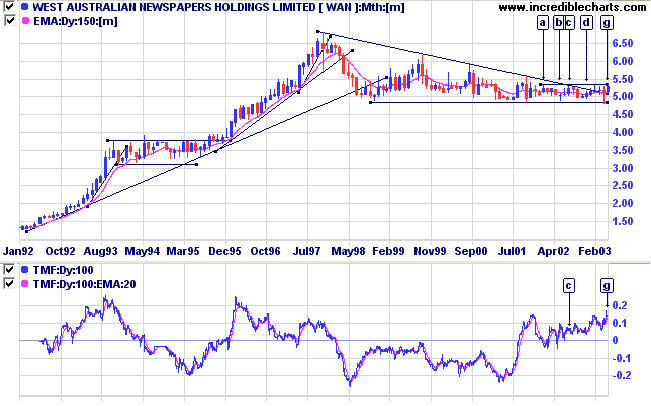
MACD and Twiggs Money Flow (21) are bullish.
Relative Strength (price ratio: xao) is rising.
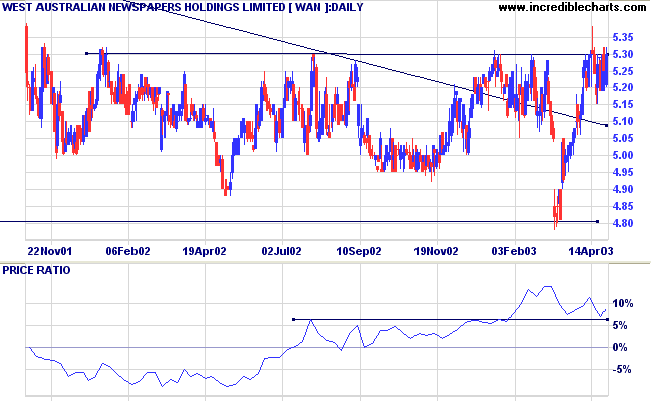
- WAN encountered strong selling pressure at [1] but overcame this without any significant retracement;
- the stock rallied strongly to [3];
- the weak correction to [4] signals strong buying support;
- again, at [5], WAN was able to overcome selling pressure to break above resistance;
- the rally ran out of steam at [6] but the correction was short and volume dried up at [8];
- price is consolidating just below the resistance level, with 2 more tests of resistance, albeit on light volume.
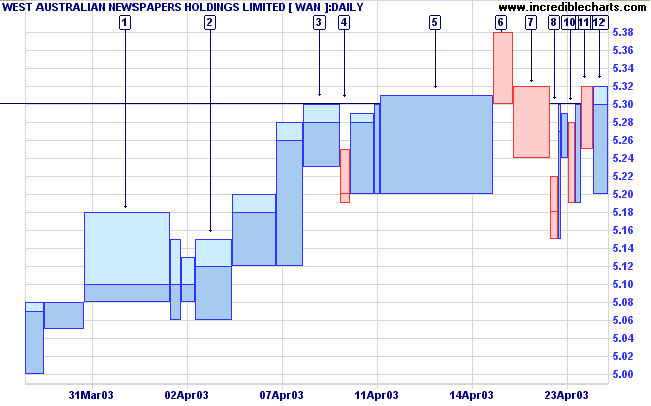
More conservative traders may enter on a break above 5.30; possibly adding to the position on a subsequent pull-back, if it respects the new support level.
A break below 5.15 would be bullish.
As far as the laws of mathematics refer to
reality, they are not certain;
and as far as they are certain, they do not refer to
reality.
- Albert Einstein.
Back Issues

Author: Colin Twiggs is a former investment banker with almost 40 years of experience in financial markets. He co-founded Incredible Charts and writes the popular Trading Diary and Patient Investor newsletters.
Using a top-down approach, Colin identifies key macro trends in the global economy before evaluating selected opportunities using a combination of fundamental and technical analysis.
Focusing on interest rates and financial market liquidity as primary drivers of the economic cycle, he warned of the 2008/2009 and 2020 bear markets well ahead of actual events.
He founded PVT Capital (AFSL No. 546090) in May 2023, which offers investment strategy and advice to wholesale clients.