US indexes and ASX hourly updates are now available
to Premium members. See What's New for details.
Check Help >> About to ensure that your software has been updated to Incredible Charts version 4.0.2.200.
Earlier versions will no longer work with the new data.
Trading Diary
May 28, 2003
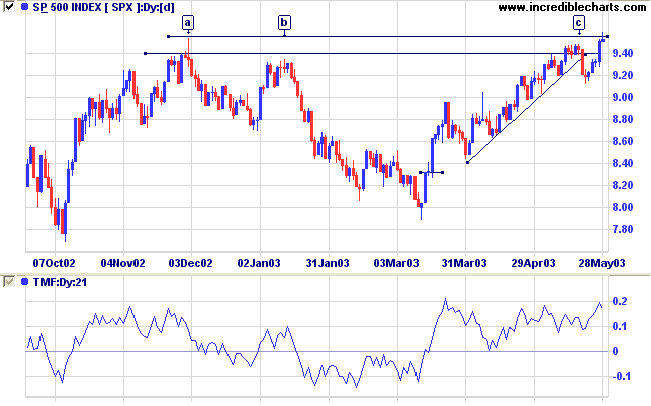
In a volatile day the Dow rallied early before retreating to close slightly higher at 8793 on strong volume.
The intermediate trend is up.
The primary trend is down; a close above 9076 will signal a reversal.
The intermediate trend is up.
The primary trend is down; a close above 954 will signal an up-trend.
The intermediate trend is up.
The index is in a primary up-trend.
Intermediate: Long if the primary trend reverses up (S&P closes above 954).
Long-term: There are already two bull signals: the March 17 follow through day and the April 3 NYSE Bullish % signal. Go long if the S&P 500 primary trend turns upwards.
San Francisco Fed President Robert Parry says: "the economy is still mired in the soft patch we hit last fall" but should experience a "modest pickup" in the second half of the year. Some economists believe that a further rate cut may be necessary to boost the recovery. (more)
New York (17.28): Spot gold eased further, to $US 363.70.
On the five-year chart gold has respected the long-term upward trendline.
The intermediate trend reversed back up, with a rise above 2973.
The primary trend is down. A rise above 3062 will signal an up-trend.
MACD (26,12,9) has crossed to above its signal line; Slow Stochastic (20,3,3) is above; and Twiggs Money Flow (21) shows accumulation.
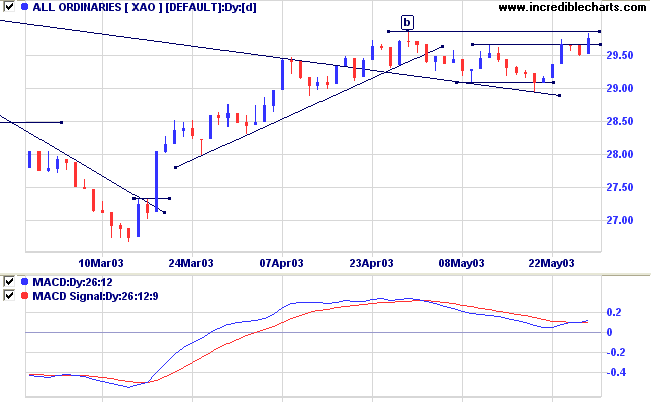
Intermediate: Long if the primary trend reverses up ( crosses above 3062 ); short if the XAO is below 2908.
Long-term: There is already a bull signal: the March 18 follow through. Wait for confirmation from a primary trend reversal.
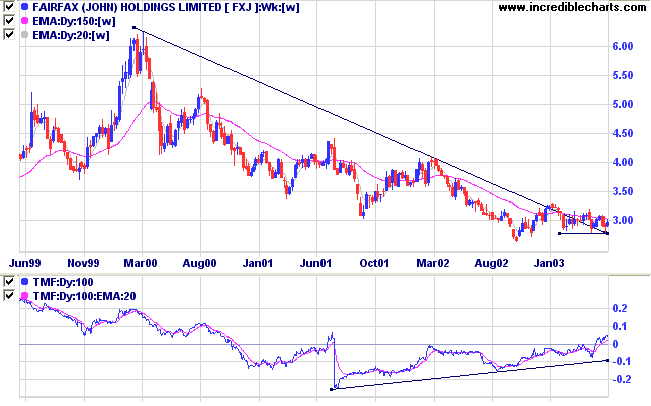
Last covered on May 28, 2002.
FXJ is forming a stage 1 base after a lengthy down-trend.
Twiggs Money Flow (100) has risen above zero, signaling accumulation, after a bullish divergence.
The weak closes at [5] and [7] on high volume signal accumulation.
Overhead resistance is strong, with levels at 3.10 [6], 3.20 [4] and 3.30 [2].
The latest rally shows a weak close at [8] on moderate volume; a sign that price may re-test support at 2.80.
Relative Strength (price ratio: xao) is level but MACD is rising; Twiggs Money Flow (21) signals accumulation.
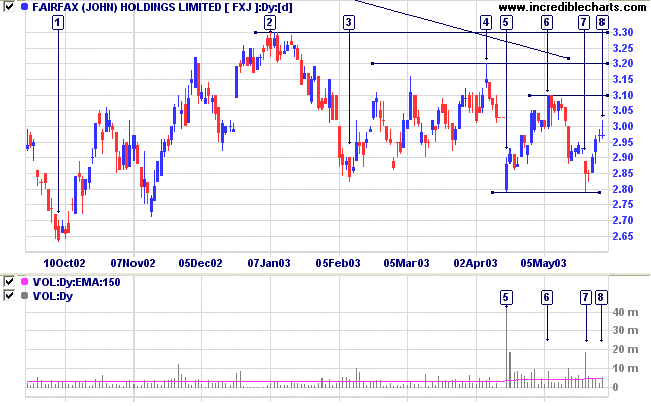
A close below 2.80 will be bearish.
I believe a leaf of grass is no less
than the journeywork of the stars.
- Walt Whitman
Click here to access the Trading Diary Archives.
Back Issues

Author: Colin Twiggs is a former investment banker with almost 40 years of experience in financial markets. He co-founded Incredible Charts and writes the popular Trading Diary and Patient Investor newsletters.
Using a top-down approach, Colin identifies key macro trends in the global economy before evaluating selected opportunities using a combination of fundamental and technical analysis.
Focusing on interest rates and financial market liquidity as primary drivers of the economic cycle, he warned of the 2008/2009 and 2020 bear markets well ahead of actual events.
He founded PVT Capital (AFSL No. 546090) in May 2023, which offers investment strategy and advice to wholesale clients.