|
ETOs and
Warrants We are making progress. ETOs and warrants will be available shortly. US stocks to follow. |
Trading Diary
September 30, 2003
These extracts from my daily trading diary
are for educational purposes
and should not be interpreted as investment
advice. Full terms and conditions can be found at Terms
of Use .
USA
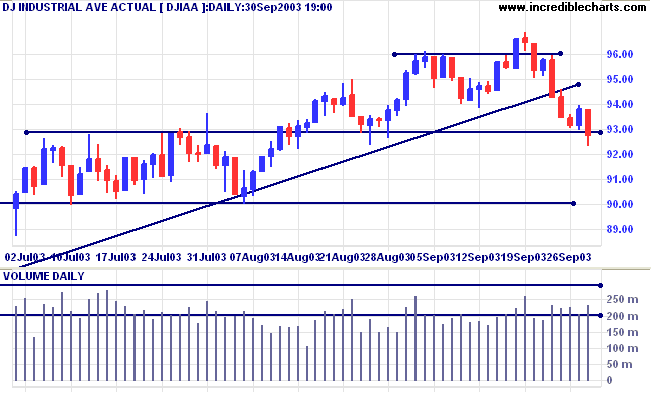
The Dow Industrial Average reversed down to close at 9275 on
higher volume.
The intermediate has turned down.
The primary trendline has been broken, signaling weakness. A fall below 9000 will signal reversal.
The intermediate has turned down.
The primary trendline has been broken, signaling weakness. A fall below 9000 will signal reversal.
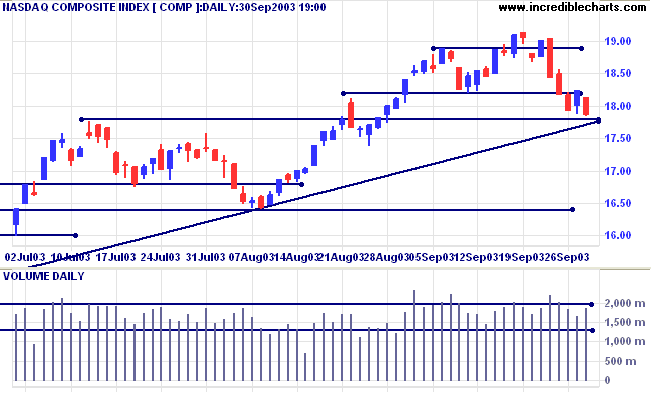
The Nasdaq Composite closed down 38 points at 1787 on higher
volume.
The intermediate trend is down.
The primary trend is up. Price appears headed for a re-test of the supporting trendline. A fall below 1640 will signal reversal.
The intermediate trend is down.
The primary trend is up. Price appears headed for a re-test of the supporting trendline. A fall below 1640 will signal reversal.
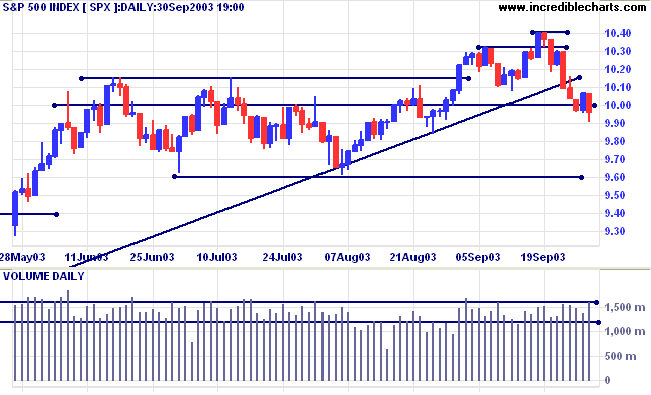
The S&P 500 lost 11 points to close at 996 on strong
volume.
The intermediate trend has turned down.
The primary trend is up. The trendline has been broken, signaling weakness. A fall below 960 will signal reversal.
The intermediate trend has turned down.
The primary trend is up. The trendline has been broken, signaling weakness. A fall below 960 will signal reversal.
The Chartcraft NYSE Bullish % Indicator was at
78.34% (September 30). Watch out for a Bear
Alert if there is a 3-box reversal.
Market Strategy
Short-term: Bearish below 995.
Intermediate: Bullish above 1040. Bearish below 960.
Long-term: Bullish above 1040.
Short-term: Bearish below 995.
Intermediate: Bullish above 1040. Bearish below 960.
Long-term: Bullish above 1040.
Is the US a place to invest?
The US market is under-performing several other major economies and the trend is expected to continue. (more)
The US market is under-performing several other major economies and the trend is expected to continue. (more)
Confidence falls
The Conference Board index of consumer confidence surprised watchers with a fall to 76.8, from 81.7 in August. (more)
The Conference Board index of consumer confidence surprised watchers with a fall to 76.8, from 81.7 in August. (more)
Treasury yields
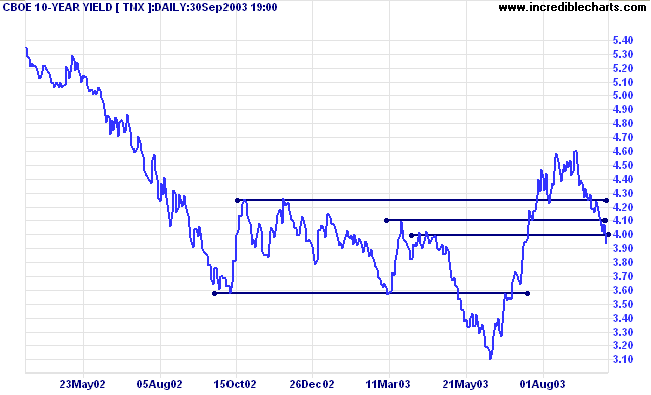
The yield on 10-year treasury notes closed at 3.94%, below support at 4.00%.
The intermediate trend is down.
The primary trend is up. The close below 4.00% signals weakness.
The yield on 10-year treasury notes closed at 3.94%, below support at 4.00%.
The intermediate trend is down.
The primary trend is up. The close below 4.00% signals weakness.
Gold
New York (20:12): Spot gold gained 3 dollars to $384.50.
The primary trend is up. Expect heavy resistance between 400 and 415 (the 10-year high).
New York (20:12): Spot gold gained 3 dollars to $384.50.
The primary trend is up. Expect heavy resistance between 400 and 415 (the 10-year high).
ASX Australia
The All Ordinaries formed a doji on strong volume, signaling
indecision, closing up 6 points at 3176.
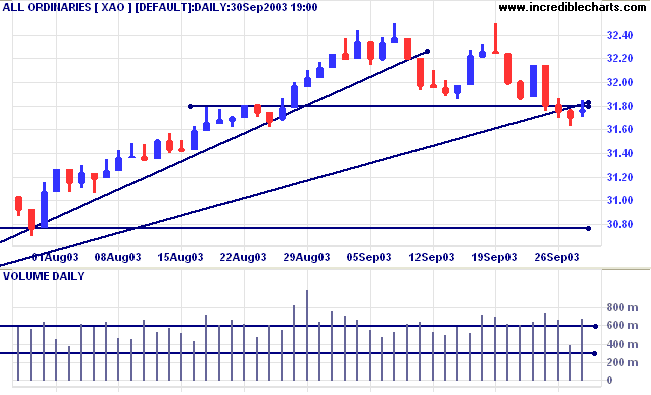
The intermediate trend is down.
The primary trend is up. A fall below 3000 will signal reversal.
MACD (26,12,9) is below its signal line; Slow Stochastic (20,3,3) is below;
Twiggs Money Flow (100) displays two bearish peaks below the signal line.
The primary trend is up. A fall below 3000 will signal reversal.
MACD (26,12,9) is below its signal line; Slow Stochastic (20,3,3) is below;
Twiggs Money Flow (100) displays two bearish peaks below the signal line.
Market Strategy
Short-term: Bullish if the All Ords is above 3250. Bearish below 3162.
Intermediate: Bullish above 3250.
Long-term: Bullish above 3000.
Short-term: Bullish if the All Ords is above 3250. Bearish below 3162.
Intermediate: Bullish above 3250.
Long-term: Bullish above 3000.
Aristocrat [ALL]
Last covered on November 28, 2002.
Aristocrat experienced a cathartic sell-off at the end of May, with exceptionally high volumes. The stock has since rallied, before consolidating above 1.50. Twiggs Money Flow (100) rose sharply, signaling accumulation.
Last covered on November 28, 2002.
Aristocrat experienced a cathartic sell-off at the end of May, with exceptionally high volumes. The stock has since rallied, before consolidating above 1.50. Twiggs Money Flow (100) rose sharply, signaling accumulation.
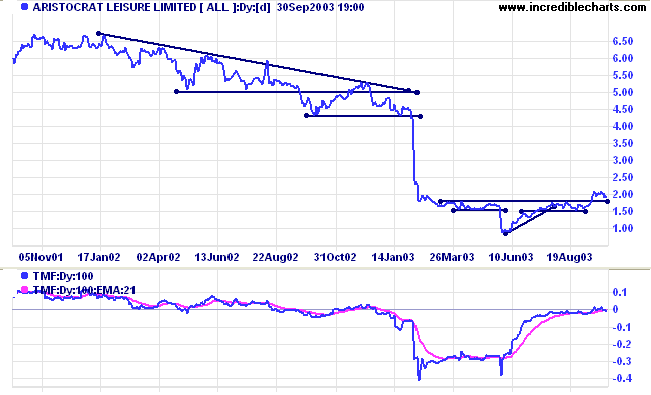
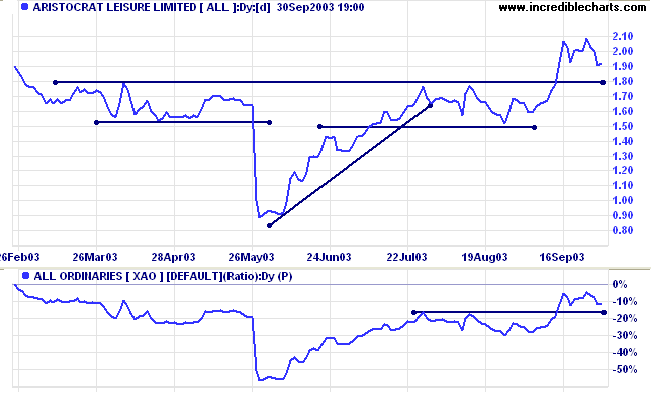
Relative Strength (price ratio: xao) formed new highs with the
break out above 1.80.
Price appears to be pulling back to test the new support level.
Price appears to be pulling back to test the new support level.
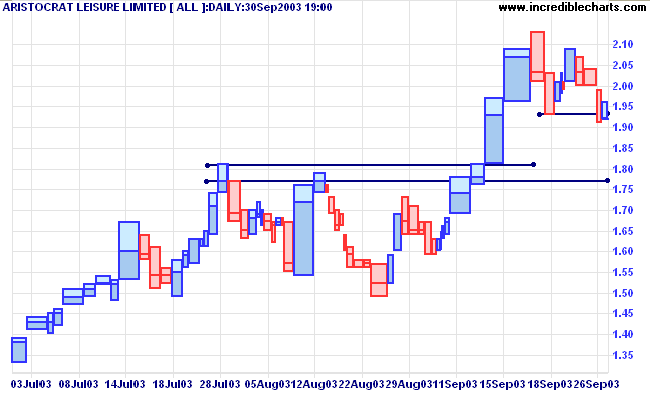
On the equivolume chart we can see that support has formed
between 1.77 and 1.81. A successful test of the support level,
accompanied by a dry up of volume and volatility, or a strong
reversal
day, will present entry opportunities.
A close below 1.77 will be bearish.
A close below 1.77 will be bearish.
CSL Limited [CSL]
Last covered July 16, 2003.
It is vital when trading breakouts to examine Relative Strength (price ratio: xao). The indicator must be rising for the breakout to be healthy. There is more than one way of measuring this. I prefer to compare highs and lows as with the trend on a price chart:
Last covered July 16, 2003.
It is vital when trading breakouts to examine Relative Strength (price ratio: xao). The indicator must be rising for the breakout to be healthy. There is more than one way of measuring this. I prefer to compare highs and lows as with the trend on a price chart:
- a higher low followed by a new high signals reversal to an up-trend;
- a lower high followed by a new low signals reversal to a down-trend.
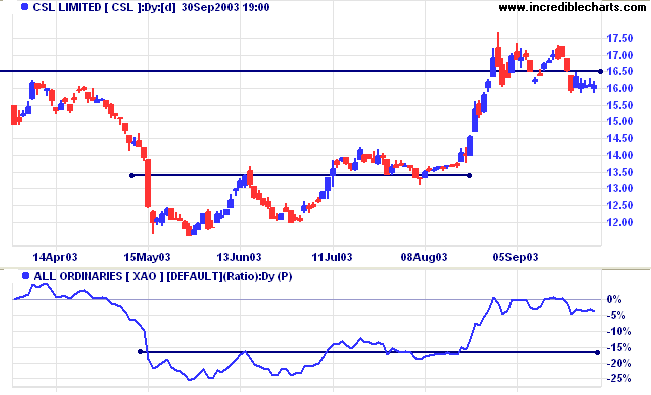
CSL has consolidated at resistance around 16.50. A break
above the consolidation high will be bullish; a break below the
recent low, bearish.
News Corporation [NCP]
Last covered on August 13, 2003.
After making a new 3-month high, Relative Strength has retreated back within its previous range. Price has also made a marginal break above 13.00; a bearish sign. If RS falls to a new 3-month low, this will be a further bear signal.
Last covered on August 13, 2003.
After making a new 3-month high, Relative Strength has retreated back within its previous range. Price has also made a marginal break above 13.00; a bearish sign. If RS falls to a new 3-month low, this will be a further bear signal.
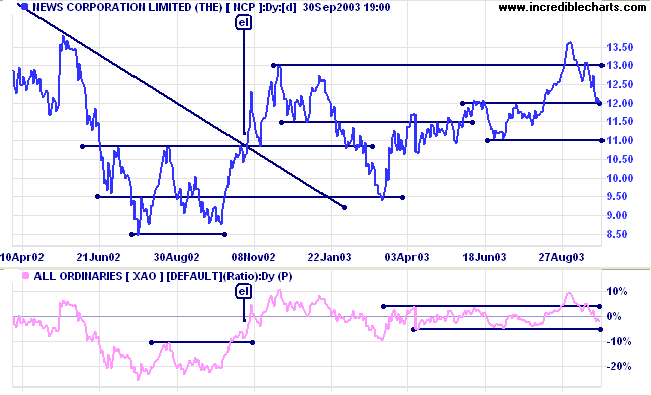
Note the small bonus earlier at [el]: price made a small
pull-back just below the neckline of a double bottom pattern,
while RS had made a new 3-month high and the pull-back respected
the new support level. This was a high probability trade for the
short-/intermediate-term, just falling short of the target of
13.10 (10.80 + 10.80 - 8.50). With hindsight the target should
have been calculated from the second leg of the pattern: 12.84
(10.80 + 10.80 - 8.76).
Understanding
the Trading Diary has been expanded to offer further
assistance to readers, including
directions on how to search the archives.
Colin Twiggs
To understand others is to be
knowledgeable;
To understand yourself is to be wise;
To conquer others is to have strength;
To conquer yourself is to be strong.
~ Lao Tse.
To understand yourself is to be wise;
To conquer others is to have strength;
To conquer yourself is to be strong.
~ Lao Tse.
Stock Screening: Stage 1 Base
|
To scan for stocks that are in a stage 1
base, try the following: (1) Select the ASX 200 or ASX 300 under Indices & Watchlists; (2) Select %of Price High; (3) Enter 80 as the 3-Month Minimum; (4) Enter 50 as the 3-Year Maximum; (5) Submit. This is not a perfect solution but will return stocks near the upper end of a stage 1 base. |
Back Issues
You can now view back issues at the Daily Trading Diary Archives.
You can now view back issues at the Daily Trading Diary Archives.
Back Issues
Access the Trading Diary Archives.

Author: Colin Twiggs is a former investment banker with almost 40 years of experience in financial markets. He co-founded Incredible Charts and writes the popular Trading Diary and Patient Investor newsletters.
Using a top-down approach, Colin identifies key macro trends in the global economy before evaluating selected opportunities using a combination of fundamental and technical analysis.
Focusing on interest rates and financial market liquidity as primary drivers of the economic cycle, he warned of the 2008/2009 and 2020 bear markets well ahead of actual events.
He founded PVT Capital (AFSL No. 546090) in May 2023, which offers investment strategy and advice to wholesale clients.