| Searching the Trading Diary Archives |
Use the normal Search function at the
top of the website page:
EXAMPLE |
Trading Diary
July 16, 2003
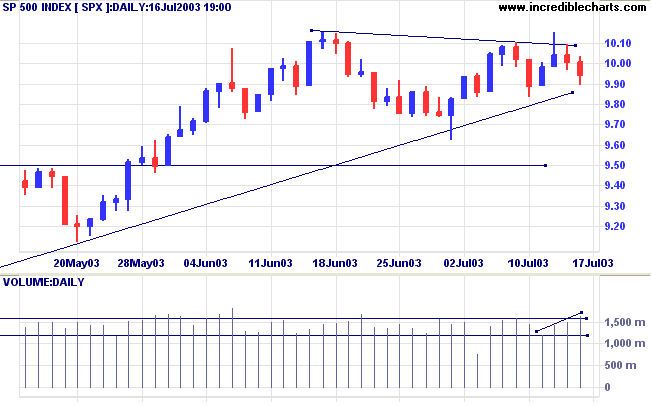
The Dow lost another 0.4% to close at 9094. Continued strong volume on the decline is a bearish sign, as are the two equal highs below the previous high.
The intermediate trend is up. A decline below 8978 will signal a down-turn.
The primary trend is up.
The intermediate trend is up. A fall below 962 will signal a down-turn.
The primary trend is up.
The intermediate trend is up.
The primary trend is up.
Intermediate: Long if the S&P is above 1015. Short if the index falls below 962.
Long-term: Long.
Motorola earnings and outlook are affected by SARS in Asia. (Motorola)
Lucent suffers from declining wireless revenues. (Lucent)
The 10-year Treasury note reached 4.0% intra-day, closing at 3.92%.(more)
New York (17.39): Spot gold has leveled out at $US 343.30.
Gold is above the long-term upward trendline on the five year chart.
The intermediate trend is up.
The primary trend is up.
MACD (26,12,9) has crossed to above its signal line, completing a second bullish trough above zero [+]; Slow Stochastic (20,3,3) is above; Twiggs Money Flow (21) signals accumulation.
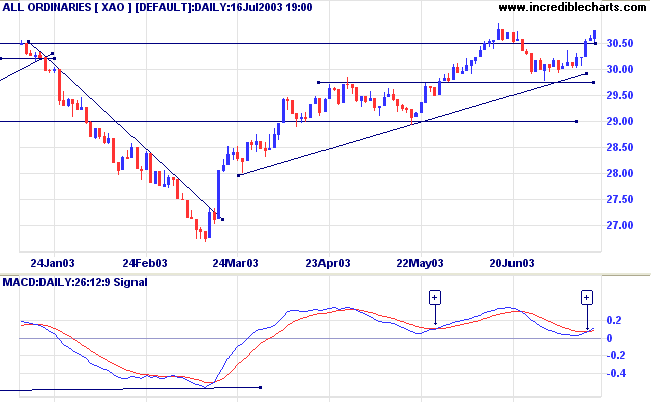
Intermediate: The primary trend is up; Long if the All Ords is above 3066.
Long-term: Long.
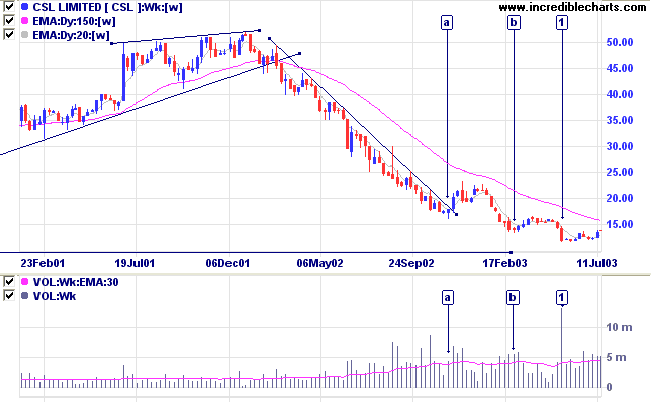
Last covered on February 25,2003.
CSL broke above its downward trendline at [a] but the rally petered out and rolled over into a lower low at [b].
We then had another attempt at a V-bottom at [b], again with similar results.
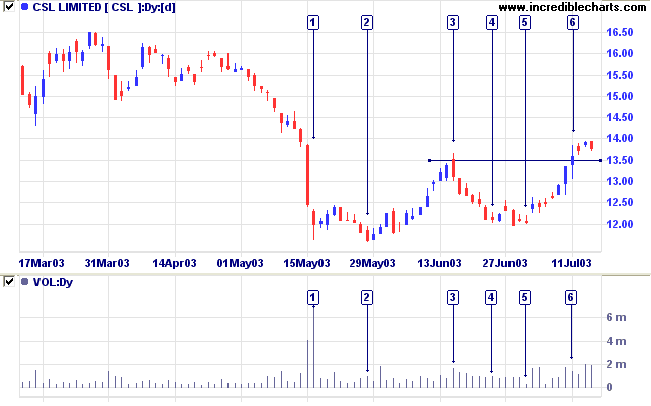
This was followed by a shakeout, with a sharp drop to a new low at [1] accompanied by a large volume spike. Shakeouts have a cathartic effect, relieving selling pressure and introducing a swathe of new owners with a more positive outlook, having purchased at lower prices.
MACD and Twiggs Money Flow (21) both display bullish divergences.
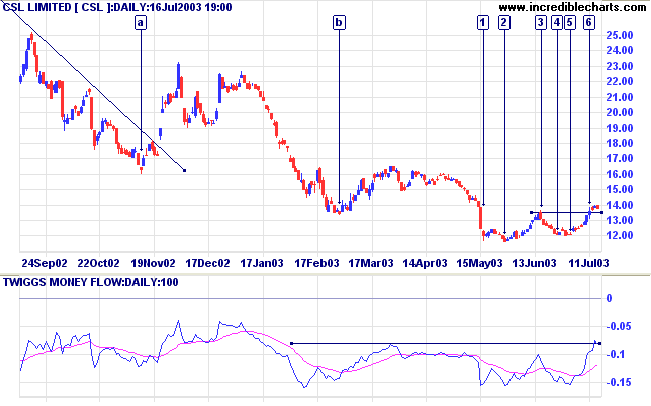
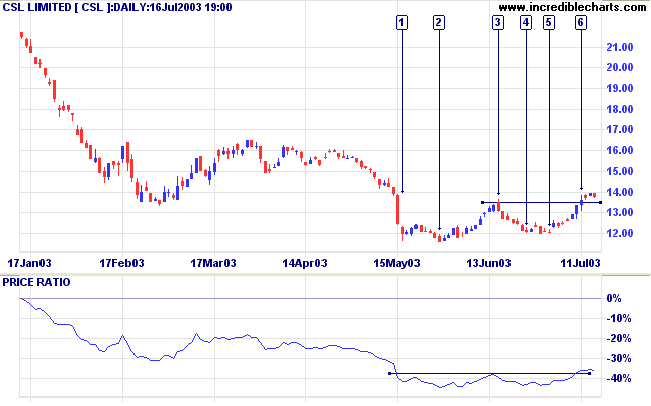
On an upward price spike volume tends to fade before the peak, but downward spikes (or shakeouts) normally experience the heaviest volume at the low.
The release of selling pressure is evident on the re-test of support at [2] with far lower volume.
The subsequent rally ended with a closing price reversal on higher volume at [3], signaling that the stock was unable to sustain higher prices.
The test of support at [4] is accompanied by lower volume and is followed by a strong bull signal: equal lows ([4] and [5]) above a previous low [2]. The second low was also accompanied by a dry-up of volume and volatility; further bullish signs.
Short-term traders may enter with a buy-stop above the high of [5] and a stop-loss below the low; the target being resistance at 13.50.
If the pull-back is short and respects the support level it will present entry opportunities for intermediate and long-term traders, especially if accompanied by a dry-up of volume and volatility.
A fall below 13.50 would be bearish.
will not have the care of great ones.
~ Wall Street maxim
S.A. Nelson: The ABC of Stock Speculation (1902).
| Stock Screens: Gaps |
|
Screening for gaps on their own
often presents the trader with large numbers of
meaningless gaps. To highlight major gaps, combine
these two filters: |
You can now view back issues at the Daily Trading Diary Archives.
Back Issues

Author: Colin Twiggs is a former investment banker with almost 40 years of experience in financial markets. He co-founded Incredible Charts and writes the popular Trading Diary and Patient Investor newsletters.
Using a top-down approach, Colin identifies key macro trends in the global economy before evaluating selected opportunities using a combination of fundamental and technical analysis.
Focusing on interest rates and financial market liquidity as primary drivers of the economic cycle, he warned of the 2008/2009 and 2020 bear markets well ahead of actual events.
He founded PVT Capital (AFSL No. 546090) in May 2023, which offers investment strategy and advice to wholesale clients.