Incredible
Posts: Best of the Forum
A collection of the most highly-rated posts since the start of the Forum.
Thanks to Mosaic for coming up with the idea and providing the initial list.
A collection of the most highly-rated posts since the start of the Forum.
Thanks to Mosaic for coming up with the idea and providing the initial list.
Trading Diary
December 2, 2003
These extracts from my daily trading diary
are for educational purposes
and should not be interpreted as investment
advice. Full terms and conditions can be found at Terms
of Use .
USA
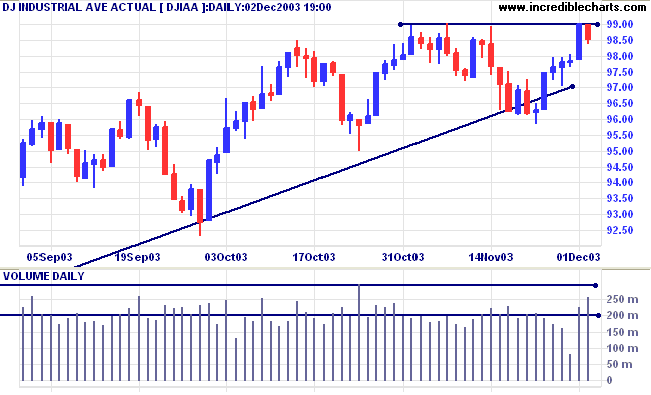
The Dow Industrial Average encountered
resistance at 9900, retreating to close at 9853. Higher volume
confirms increased selling pressure.
The intermediate trend is uncertain.
The primary trend is up. A fall below support at 9000 will signal reversal.
The intermediate trend is uncertain.
The primary trend is up. A fall below support at 9000 will signal reversal.
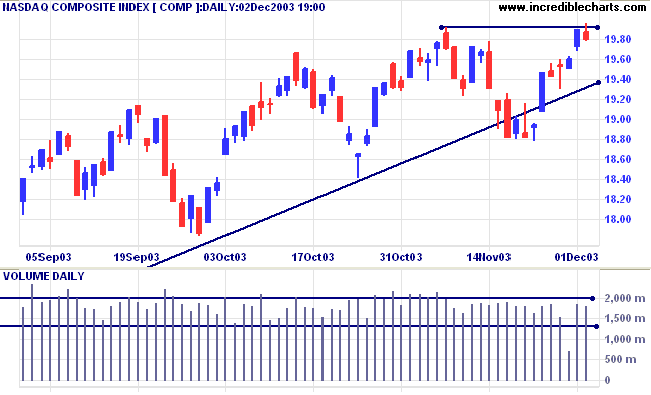
The Nasdaq Composite made a false break above
resistance before retreating back to close at 1980 on average
volume.
The intermediate trend is uncertain.
The primary trend is up. A fall below support at 1640 will signal reversal.
The intermediate trend is uncertain.
The primary trend is up. A fall below support at 1640 will signal reversal.
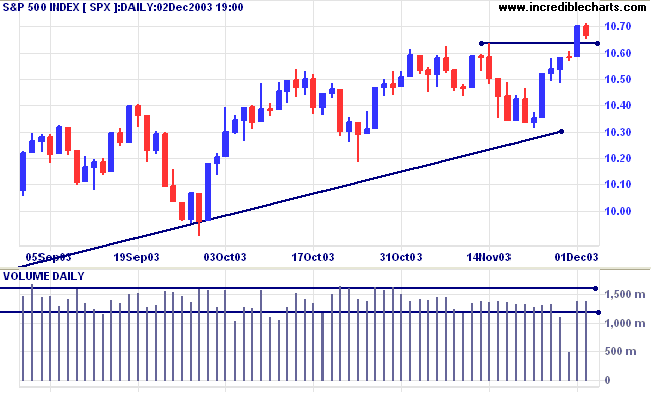
The S&P 500 appears to be consolidating
above the new support level, closing 4 points lower at 1066 on
average volume.
The intermediate trend is uncertain.
Short-term: Bullish if the S&P500 is above support at 1064. Bearish below 1034 (last Tuesday's low).
The intermediate trend is uncertain.
Short-term: Bullish if the S&P500 is above support at 1064. Bearish below 1034 (last Tuesday's low).
The primary trend is up. A fall below 960 will
signal reversal.
Intermediate: Bullish above 1064.
Long-term: Bullish above 960.
Intermediate: Bullish above 1064.
Long-term: Bullish above 960.
The Chartcraft NYSE Bullish % Indicator increased
sharply to 81.72% (December 2).
Job cuts decline
99,000 jobs were cut in November, compared to 171,000 in October. (more)
Treasury yields
The yield on 10-year treasury notes eased to 4.38%.
The intermediate trend is down after bearish equal highs below a higher peak.
The primary trend is up.
The yield on 10-year treasury notes eased to 4.38%.
The intermediate trend is down after bearish equal highs below a higher peak.
The primary trend is up.
Gold
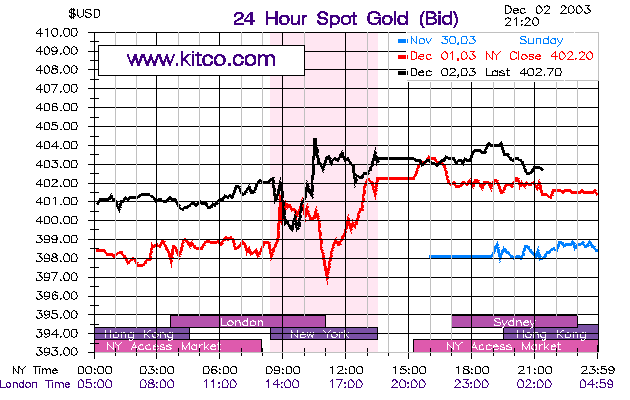
New York (21.20): Spot gold held above the new 400 support level, currently at $402.70.
The intermediate trend is up.
The primary trend is up. Expect resistance at 415.
New York (21.20): Spot gold held above the new 400 support level, currently at $402.70.
The intermediate trend is up.
The primary trend is up. Expect resistance at 415.
ASX Australia
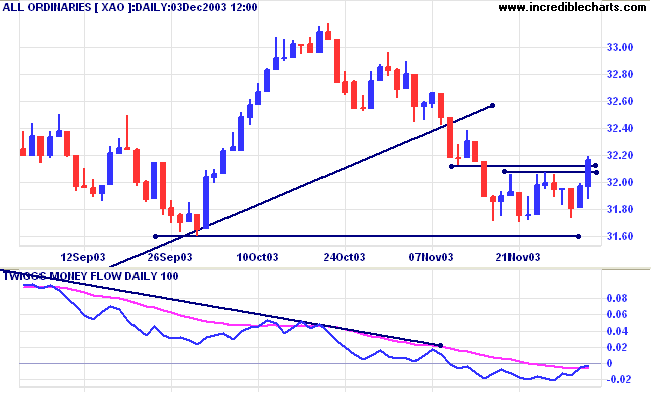
Wednesday 13.00: The All Ordinaries has broken through resistance
at 3207 to 3212, after closing Tuesday at 3197.
The intermediate trend has reversed up.
MACD (26,12,9) is below its signal line; Slow Stochastic (20,3,3) is below.
Short-term: Bullish if the All Ords crosses above 3212, the November 12 low. Bearish below 3180 (Tuesday's low).
MACD (26,12,9) is below its signal line; Slow Stochastic (20,3,3) is below.
Short-term: Bullish if the All Ords crosses above 3212, the November 12 low. Bearish below 3180 (Tuesday's low).
XAO is below its long-term trendline, signaling weakness. The
primary trend is up but will reverse if there is a fall below
3160 (the October 1 low). Declining weekly volume increases the
likelihood that support at 3160 will hold. Twiggs Money Flow
(100) has crossed above its signal line after a bearish triple
divergence.
Intermediate term: Bullish above 3212. Bearish below 3160.
Long-term: Bearish below 3160.
Intermediate term: Bullish above 3212. Bearish below 3160.
Long-term: Bearish below 3160.
Gunns [GNS]
Last covered on February 4, 2003.
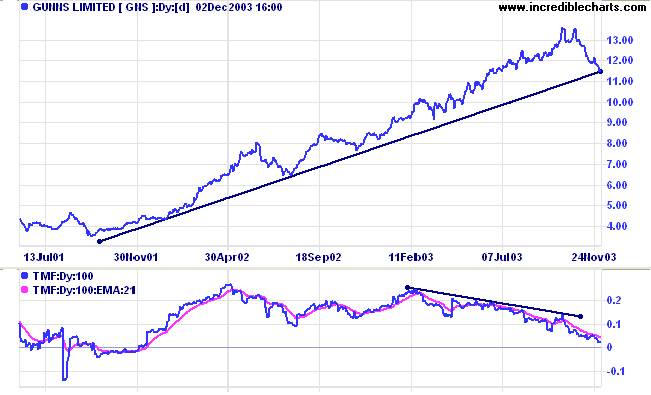
Gunns has been in a strong stage 2 up-trend for a number of years. Price has now corrected back to the primary supporting trendline after a narrow double top in October and a bearish divergence on Twiggs Money Flow (100).
Last covered on February 4, 2003.
Gunns has been in a strong stage 2 up-trend for a number of years. Price has now corrected back to the primary supporting trendline after a narrow double top in October and a bearish divergence on Twiggs Money Flow (100).
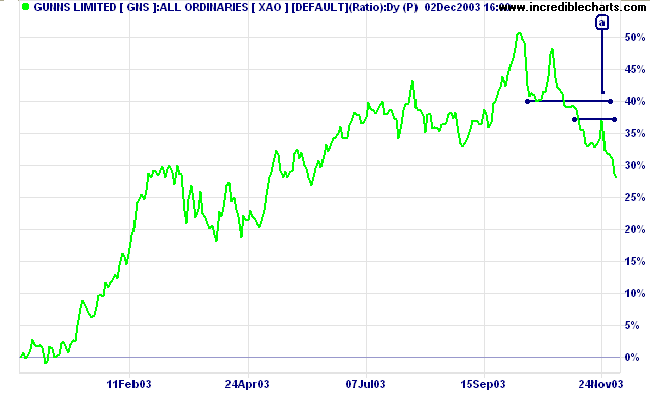
Relative Strength (xao) is falling. A gap between the latest peak
and the previous trough is a bear signal when observed on the
price chart. It is an even stronger signal when confirmed [a] on
the RS chart.
St George Bank [SGB]
Last covered November 10, 2003.
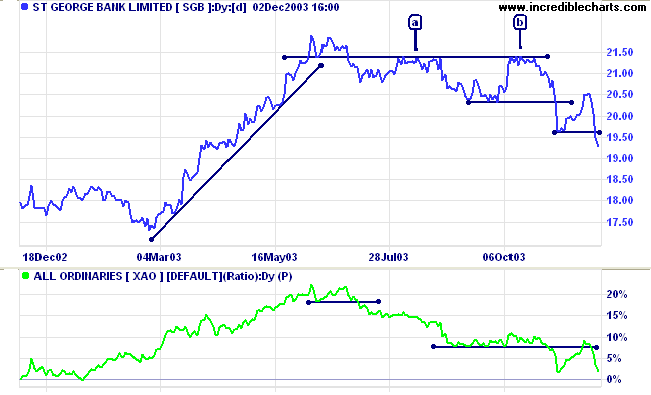
SGB has declined after bearish equal highs below a previous peak, at [a] and [b]. Relative Strength (xao) has declined since the June high.
Last covered November 10, 2003.
SGB has declined after bearish equal highs below a previous peak, at [a] and [b]. Relative Strength (xao) has declined since the June high.
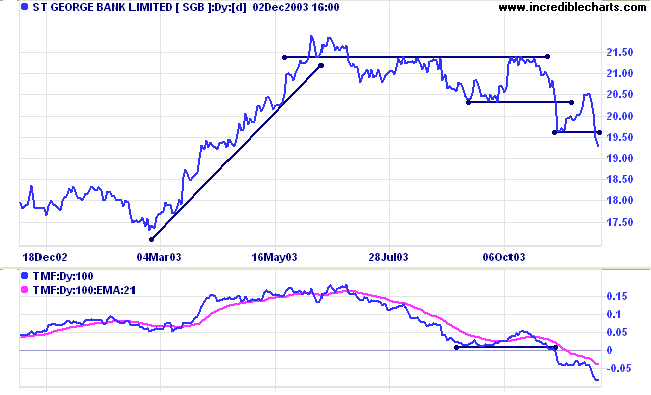
Twiggs Money Flow (100) shows a similar pattern to other banks,
with a sharp fall signaling distribution.
Understanding
the Trading Diary has been expanded to offer further
assistance to readers, including
directions on how to search the archives.
Colin Twiggs
Expectancy and probability of winning are not
the same thing.
People have a bias to want to be right on every trade or investment.
As a result, they tend to gravitate toward high probability entry systems.
Yet quite often these systems are also associated with large losses
and lead to negative expectancy.
~ Van K Tharp: Trade your way to Financial Freedom.
People have a bias to want to be right on every trade or investment.
As a result, they tend to gravitate toward high probability entry systems.
Yet quite often these systems are also associated with large losses
and lead to negative expectancy.
~ Van K Tharp: Trade your way to Financial Freedom.
Please alert Support if you experience any difficulties with Incredible Charts File menu.
We have not received any error reports but I have noticed that the menu opens very slowly
and would like to establish whether this is specific to my PC or is experienced by others.
Back Issues
You can now view back issues at the Daily Trading Diary Archives.
Back Issues
Access the Trading Diary Archives.