Incredible Posts: Best of the Forum
A collection of the most highly-rated posts since the start of the Forum.
Thanks to Mosaic for coming up with the idea and providing the initial list.
A collection of the most highly-rated posts since the start of the Forum.
Thanks to Mosaic for coming up with the idea and providing the initial list.
Trading Diary
December 1, 2003
These extracts from my daily trading diary
are for educational purposes
and should not be interpreted as investment
advice. Full terms and conditions can be found at Terms
of Use .
USA
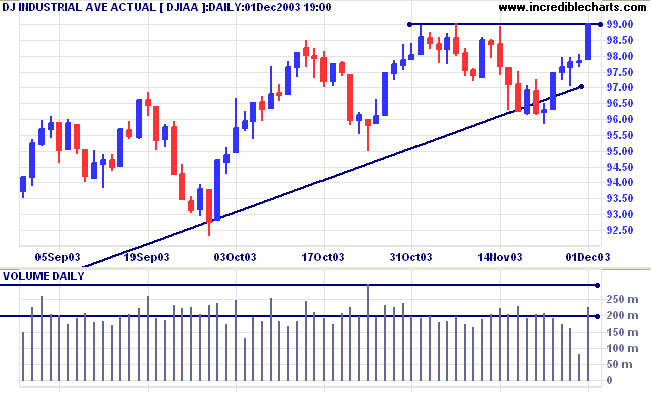
The Dow Industrial Average rallied more than 1% to close at 9899,
just below resistance at 9900.
The intermediate down-trend is weak.
The primary trend is up. A fall below support at 9000 will signal reversal.
The intermediate down-trend is weak.
The primary trend is up. A fall below support at 9000 will signal reversal.
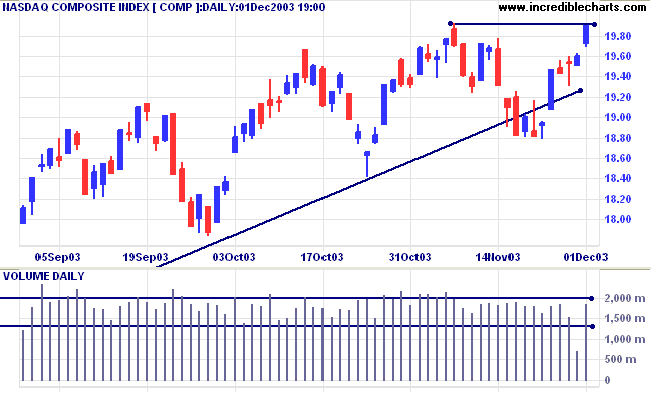
The Nasdaq Composite gapped up to close 29 points higher at 1989
on average volume, testing resistance at 1992.
The intermediate down-trend is weak.
The primary trend is up. A fall below support at 1640 will signal reversal.
The intermediate down-trend is weak.
The primary trend is up. A fall below support at 1640 will signal reversal.
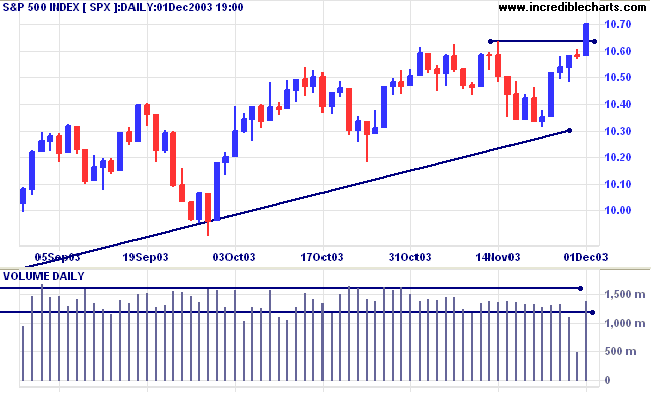
The S&P 500 broke through resistance to close up 12 points at
1070 on average volume.
The intermediate trend is uncertain.
Short-term: Bullish if the S&P500 is above the high of 1064. Bearish below 1034 ( last Tuesday's low).
The intermediate trend is uncertain.
Short-term: Bullish if the S&P500 is above the high of 1064. Bearish below 1034 ( last Tuesday's low).
The primary trend is up. A fall below 960 will signal
reversal.
Intermediate: Bullish above 1064.
Long-term: Bullish above 960.
Intermediate: Bullish above 1064.
Long-term: Bullish above 960.
The Chartcraft NYSE Bullish % Indicator increased
to 81.19% (December 1).
Manufacturing climbs
The Institute of Supply Management manufacturing index jumped to 62.8, from 57 in October. (more)
The Institute of Supply Management manufacturing index jumped to 62.8, from 57 in October. (more)
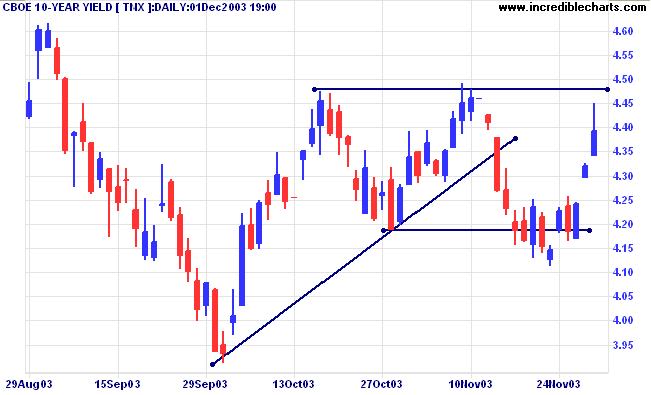
Treasury yields
The yield on 10-year treasury notes gapped again to 4.39%. The long upper shadow signals downward pressure ahead of resistance at 4.48% to 4.50%.
The intermediate trend is down after bearish equal highs below a higher peak.
The primary trend is up.
The yield on 10-year treasury notes gapped again to 4.39%. The long upper shadow signals downward pressure ahead of resistance at 4.48% to 4.50%.
The intermediate trend is down after bearish equal highs below a higher peak.
The primary trend is up.
Gold
New York (20.33): Spot gold has broken through resistance at 400 to reach $402.00.
The intermediate trend is up. Expect a pull-back to test the new 400 support level.
The primary trend is up. Expect resistance at 400 to 415.
New York (20.33): Spot gold has broken through resistance at 400 to reach $402.00.
The intermediate trend is up. Expect a pull-back to test the new 400 support level.
The primary trend is up. Expect resistance at 400 to 415.
ASX Australia
The All Ordinaries fell 16 points to 3180 on lower volume.
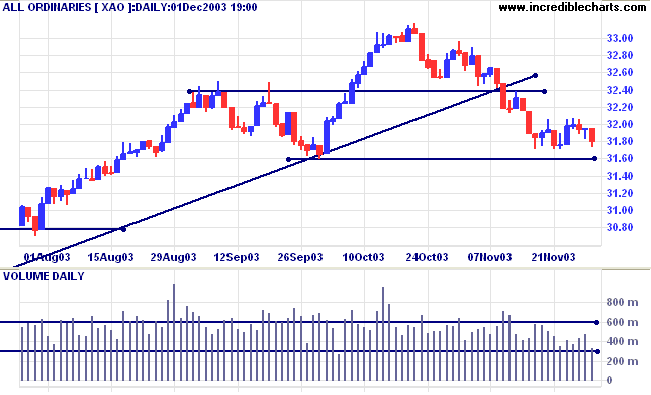
The intermediate down-trend is consolidating above support at
3160, a bearish sign.
MACD (26,12,9) is below its signal line; Slow Stochastic (20,3,3) has whipsawed below.
Short-term: Bullish if the All Ords crosses above 3212, the November 12 low. Bearish below 3182 (Friday's low).
MACD (26,12,9) is below its signal line; Slow Stochastic (20,3,3) has whipsawed below.
Short-term: Bullish if the All Ords crosses above 3212, the November 12 low. Bearish below 3182 (Friday's low).
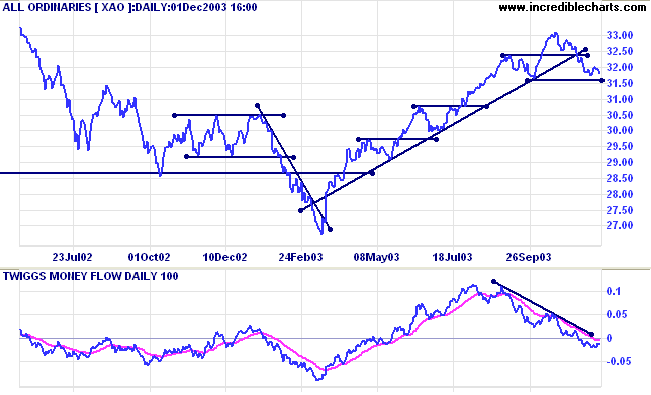
XAO is below the long-term trendline, signaling weakness. The
primary trend is up but will reverse if there is a fall below
3160 (the October 1 low). Declining weekly volume increases the
likelihood that support at 3160 will hold. Twiggs Money Flow
(100) continues to signal distribution after a bearish triple
divergence.
Intermediate term: Bullish above 3212. Bearish below 3160.
Long-term: Bearish below 3160.
Intermediate term: Bullish above 3212. Bearish below 3160.
Long-term: Bearish below 3160.
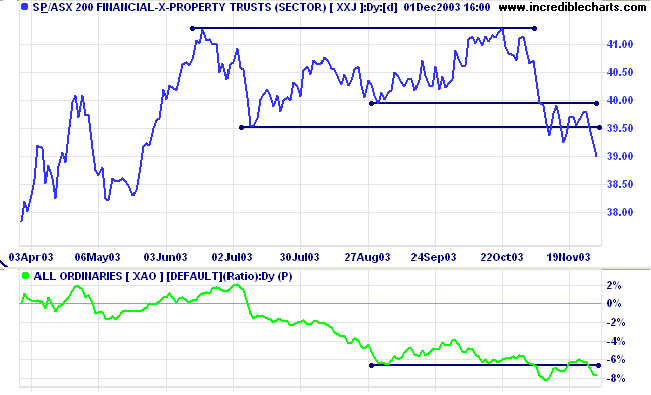
Financial Sector
Financial-x-Property [XXJ] has broken below the recent consolidation, confirming the primary down-trend. Relative Strength (xao) continues to decline.
Financial-x-Property [XXJ] has broken below the recent consolidation, confirming the primary down-trend. Relative Strength (xao) continues to decline.
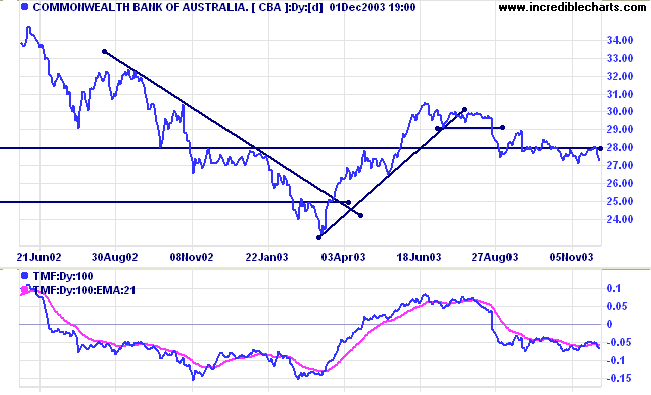
Commonwealth Bank [CBA]
Last covered November 5, 2003.
After a sharp fall below 29.00 CBA has entered a creeping down-trend, with Twiggs Money Flow (100) leveling out in a similar pattern. Relative Strength (xao) is also ranging. This pattern can resolve into either another rally or a sharp down-trend. Judging by the performance of other stocks in the sector, a downward breakout may present the better opportunity.
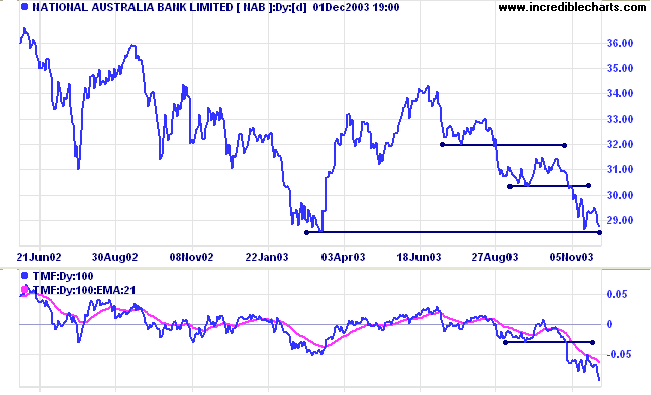
National Australia Bank [NAB]
Last covered November 5, 2003.
NAB has been in a primary down-trend since late August and is now testing a major support level at 28.50. Relative Strength (xao) continues to fall and Twiggs Money Flow gives a strong bear signal with a gap between the last trough and the latest peak. The next major support level is at 24.50 (September 2001).
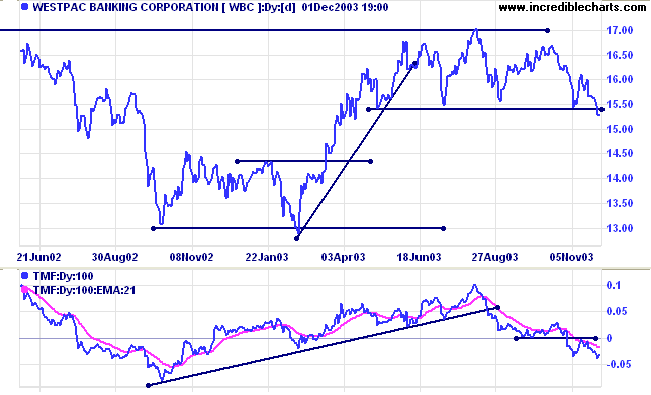
Westpac [WBC]
Last covered November 10, 2003.
Westpac has completed a head and shoulders reversal with a fall below 15.40. Relative Strength (xao) and Twiggs Money Flow (100) are both falling. TMF looks particularly bearish, completing peaks below zero. A pull-back that respects the new resistance level will be a further bearish sign. The next major support level is at 13.00.
Understanding
the Trading Diary has been expanded to offer further
assistance to readers, including
directions on how to search the archives.
Colin Twiggs
On Monday when the sun is hot
I wonder to myself a lot:
"Now is it time, or is it not,
That what is which and which is what?"
~ A A Milne: Winnie-the-Pooh.
I wonder to myself a lot:
"Now is it time, or is it not,
That what is which and which is what?"
~ A A Milne: Winnie-the-Pooh.
Please alert Support if you experience any difficulties with the File menu.
We have not received any error reports but I have noticed that the menu opens very slowly
and would like to establish whether this is specific to my PC or is experienced by others.
Back Issues
You can now view back issues at the Daily Trading Diary Archives.
You can now view back issues at the Daily Trading Diary Archives.
Back Issues
Access the Trading Diary Archives.

Author: Colin Twiggs is a former investment banker with almost 40 years of experience in financial markets. He co-founded Incredible Charts and writes the popular Trading Diary and Patient Investor newsletters.
Using a top-down approach, Colin identifies key macro trends in the global economy before evaluating selected opportunities using a combination of fundamental and technical analysis.
Focusing on interest rates and financial market liquidity as primary drivers of the economic cycle, he warned of the 2008/2009 and 2020 bear markets well ahead of actual events.
He founded PVT Capital (AFSL No. 546090) in May 2023, which offers investment strategy and advice to wholesale clients.