Trading Diary
November 18, 2003
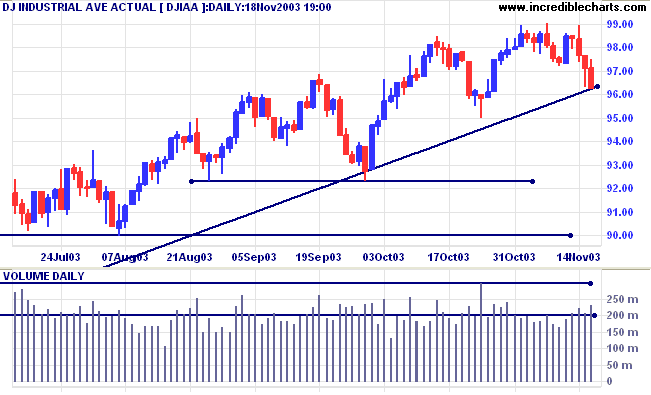
The intermediate trend is down.
The primary trend is up. A fall below 9000 will signal reversal.
The intermediate trend is down. Expect support at 1840 and 1780, the previous two lows (in October).
The primary trend is up. A fall below 1640 will signal reversal.
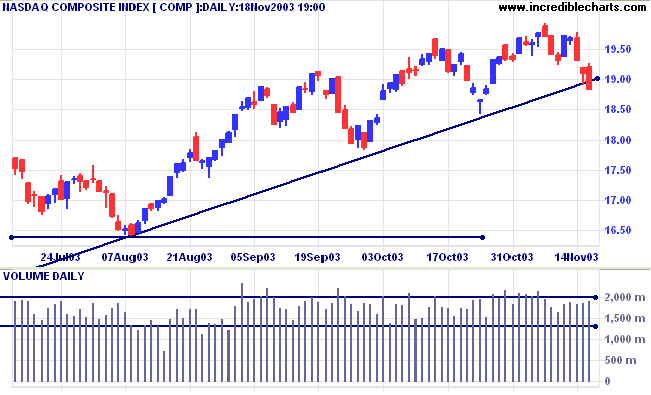
The intermediate trend is down. Expect support at the primary trendline.
Short-term: Bullish if the S&P500 is above 1062. Bearish below 1043 (last Tuesday's low).
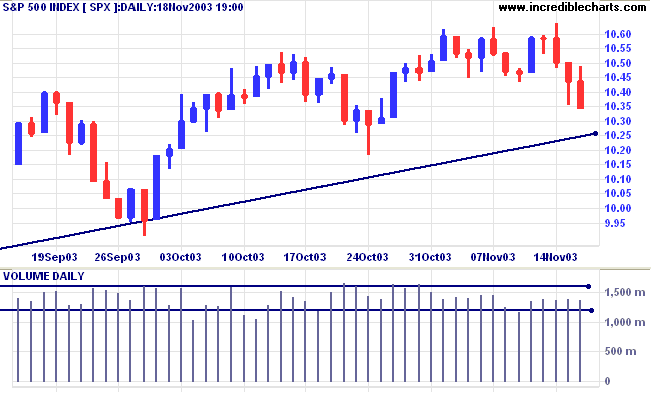
Twiggs Money Flow (100) signals distribution.
Intermediate: Bullish above 1062.
Long-term: Bullish above 960.
According to Dorsey a fall below 70% (not a 3-box reversal) would signal a bear alert.
The dollar slid to a record low, almost $1.20, against the euro. (more)
Oil prices increase to more than $33.00 per barrel, the highest level since the Iraq war. (more)
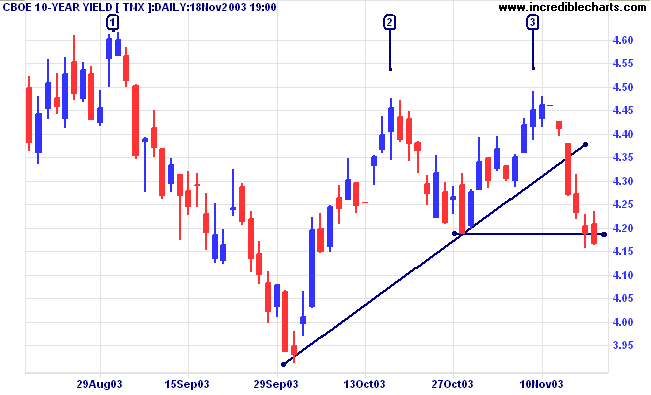
The yield on 10-year treasury notes fell to 4.17%, signaling an intermediate down-trend.
The primary trend is up.
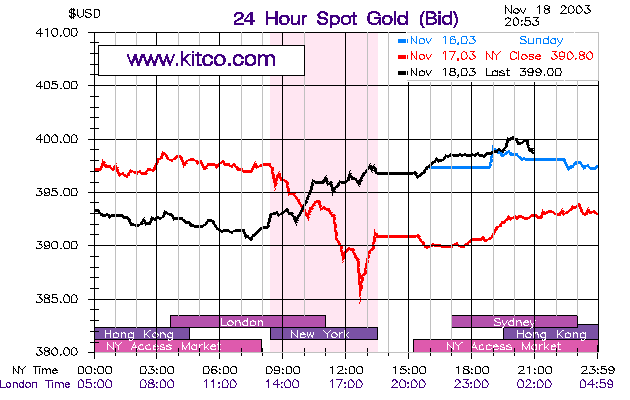
New York (20:53): Spot gold responded to the falling dollar, testing $400 before easing back to $399.00.
The intermediate trend is up.
The primary trend is up. Expect resistance at 400 to 415.
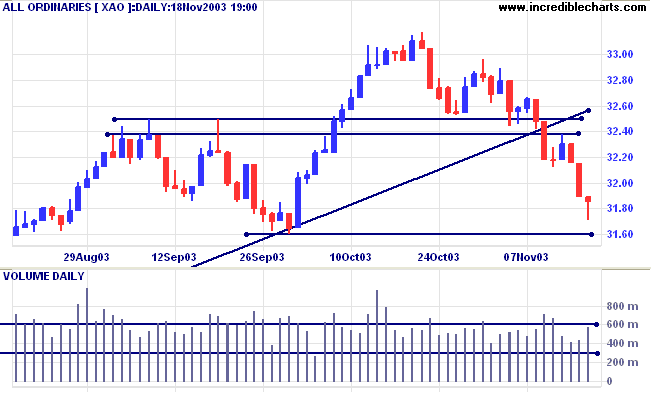
MACD (26,12,9) is below its signal line; Slow Stochastic (20,3,3) is below.
Short-term: Bullish if the All Ords crosses back above resistance at 3250. Bearish below 3238.
Intermediate term: Bullish above 3250. Bearish below 3160.
Long-term: Bearish below 3160.
Last covered on August 14, 2003.
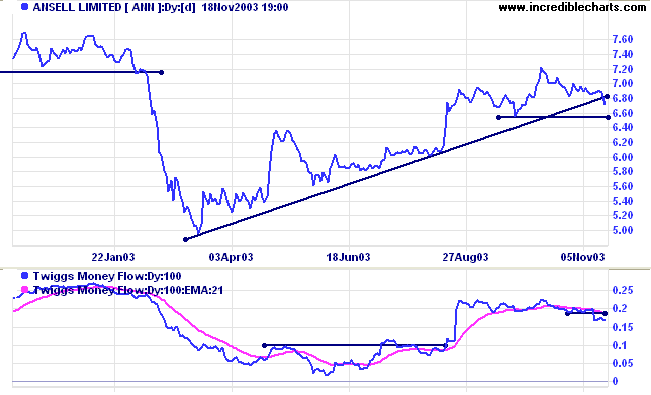
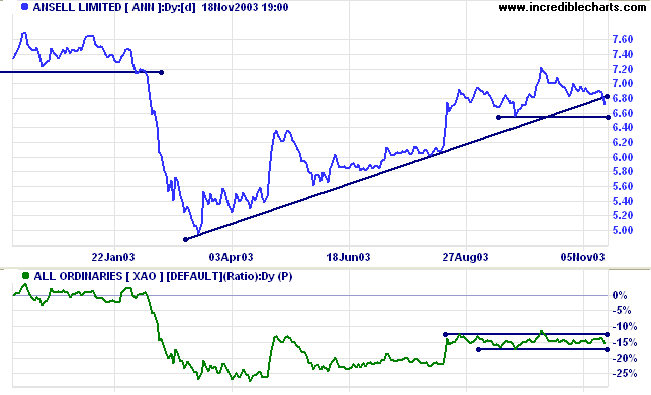
ANN formed a V-bottom in March 2003, rallying strongly before losing momentum in the past few weeks. Price has broken below the long-term trendline, while Twiggs Money Flow (100) is weakening.
Last covered on September 22, 2003.
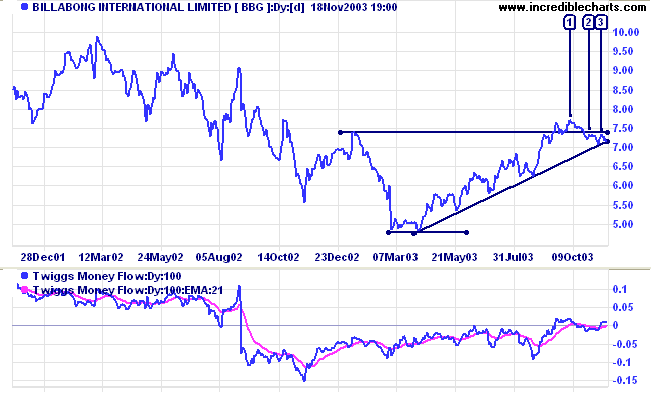
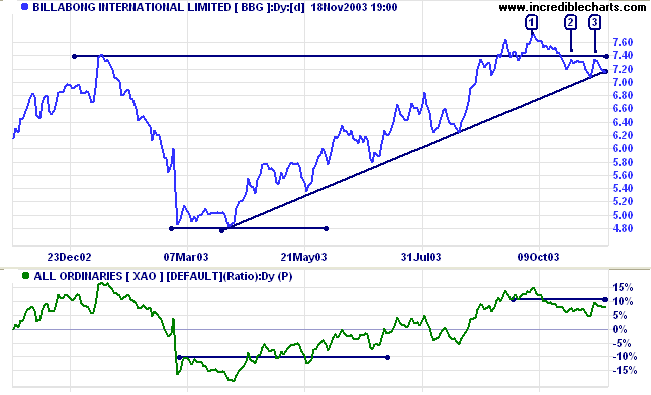
BBG broke briefly above resistance at 7.50 before retreating. Two equal highs, at [2] and [3], below the previous high at [1] are a bear signal. Price is also testing the upward trendline.
However, counter to the above, Twiggs Money Flow (100) has crossed to above zero, signaling accumulation.
Volume on downward swings is light, with weak closes above the 7.00 support level.
In a falling market it is worth screening for stocks that are rising, counter to the trend. Only committed buyers will pursue a stock in a falling market and it is normally worth following these stocks closely. To screen for short-term Relative Strength:
(1) select the ASX 200 (or other suitable index) under Indices;
(2) enter 5% as the Minimum 1-Month % Price Move;
(3) Submit.
Here is a list of the top 11 stocks returned by the screen:
|
COATES HIRE LIMITED [ COA ] ERG LIMITED [ ERG ] KINGSGATE CONSOLIDATED LIMITED [ KCN ] METCASH TRADING LIMITED [ MTT ] NEWCREST MINING LIMITED [ NCM ] OXIANA LIMITED [ OXR ] PEPTECH LIMITED [ PTD ] PMP LIMITED [ PMP ] SFE CORPORATION LIMITED [ SFE ] TAB LIMITED [ TAB ] TOLL HOLDINGS LIMITED [ TOL ] |
~ John Constable.
We are busy with the transfer to the new dual-CPU server
and expect to have US charts available this week.
You can now view back issues at the Daily Trading Diary Archives.
Back Issues

Author: Colin Twiggs is a former investment banker with almost 40 years of experience in financial markets. He co-founded Incredible Charts and writes the popular Trading Diary and Patient Investor newsletters.
Using a top-down approach, Colin identifies key macro trends in the global economy before evaluating selected opportunities using a combination of fundamental and technical analysis.
Focusing on interest rates and financial market liquidity as primary drivers of the economic cycle, he warned of the 2008/2009 and 2020 bear markets well ahead of actual events.
He founded PVT Capital (AFSL No. 546090) in May 2023, which offers investment strategy and advice to wholesale clients.

