|
Predictions I do not make predictions - the market can go up or down at any time. It is only the probability (of each move) that varies:
|
Trading Diary
September 22, 2003
These extracts from my daily trading diary
are for educational purposes
and should not be interpreted as investment
advice. Full terms and conditions can be found at Terms
of Use .
USA
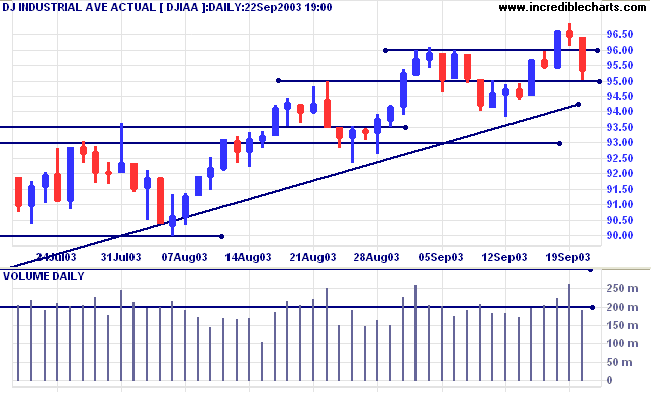
The Dow Industrial Average retreated 1.1% to close at 9535 on low
volume.
The intermediate trend is up. Continued low volume signals weakness. A fall below 9381 will be a bear signal.
The primary trend is up.
The intermediate trend is up. Continued low volume signals weakness. A fall below 9381 will be a bear signal.
The primary trend is up.
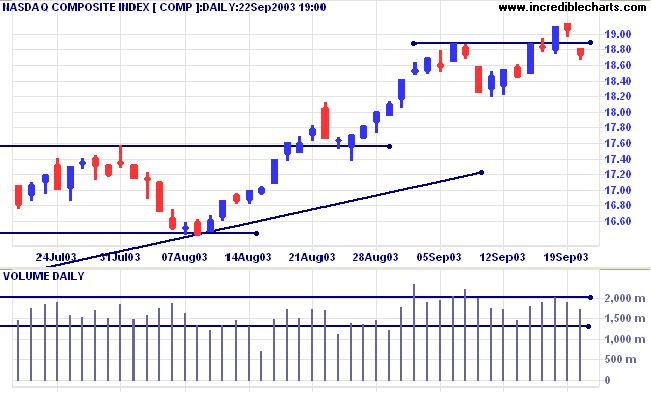
The Nasdaq Composite gapped down to close 31 points lower at 1875
on average volume.
The intermediate trend is up.
The primary trend is up.
The intermediate trend is up.
The primary trend is up.
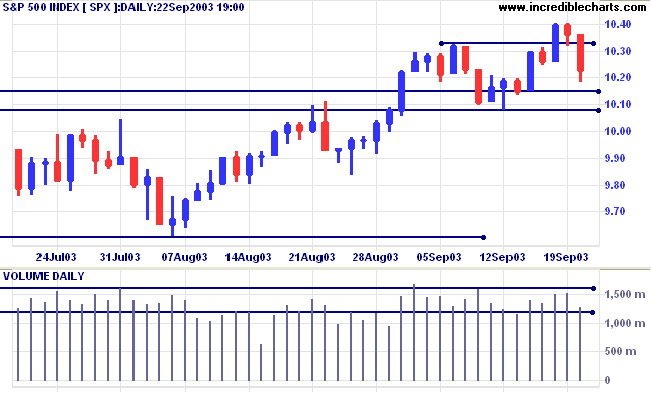
The S&P 500 lost 13 points to close at 1023 on lower volume,
headed for a re-test of support at 1008/1015.
The intermediate trend is up.
The primary trend is up.
The intermediate trend is up.
The primary trend is up.
The Chartcraft NYSE Bullish % Indicator retreated
slightly to 80.69% (September 22).
Market Strategy
Short-term: Long if the S&P500 is above 1040. Short below 1008.
Intermediate: Long if S&P 500 is above 1040.
Long-term: Long is the index is above 1008.
Short-term: Long if the S&P500 is above 1040. Short below 1008.
Intermediate: Long if S&P 500 is above 1040.
Long-term: Long is the index is above 1008.
Dollar weakens
The US dollar closed lower against the yen after the G7 finance ministers meeting in Dubai. The meeting criticized countries who manipulate exchange rates to protect exports. Japan, particularly, has intervened to prevent the US dollar from weakening. (more)
The US dollar closed lower against the yen after the G7 finance ministers meeting in Dubai. The meeting criticized countries who manipulate exchange rates to protect exports. Japan, particularly, has intervened to prevent the US dollar from weakening. (more)
Treasury yields
The yield on 10-year treasury notes recovered slightly to 4.24%, above support at 4.10% to 4.00%.
The intermediate and primary trends are both up.
The yield on 10-year treasury notes recovered slightly to 4.24%, above support at 4.10% to 4.00%.
The intermediate and primary trends are both up.
Gold
New York (18.45): Spot gold has broken through resistance at 382, reaching $386.60.
The primary trend is up.
The target for the symmetrical triangle is the 10-year high of 420.
New York (18.45): Spot gold has broken through resistance at 382, reaching $386.60.
The primary trend is up.
The target for the symmetrical triangle is the 10-year high of 420.
ASX Australia
The All Ordinaries lost 23 points to close at 3200 on strong
volume.
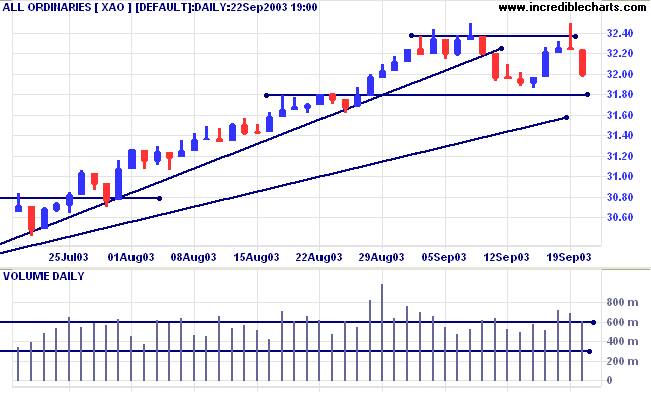
The intermediate trend is weak, with the index having broken its
intermediate trendline and formed two equal highs. A break below
3180 will signal a reversal.
The primary trend is up.
MACD (26,12,9) is below its signal line; Slow Stochastic (20,3,3) has crossed to below;
Twiggs Money Flow signals distribution, after a bearish divergence.
The primary trend is up.
MACD (26,12,9) is below its signal line; Slow Stochastic (20,3,3) has crossed to below;
Twiggs Money Flow signals distribution, after a bearish divergence.
Market Strategy
Short-term: Long above 3250. Short if below 3180.
Intermediate: Long if the index is above 3250.
Long-term: Long if the index is above 3180.
Short-term: Long above 3250. Short if below 3180.
Intermediate: Long if the index is above 3250.
Long-term: Long if the index is above 3180.
Billabong [BBG]
Last covered August 23, 2002.
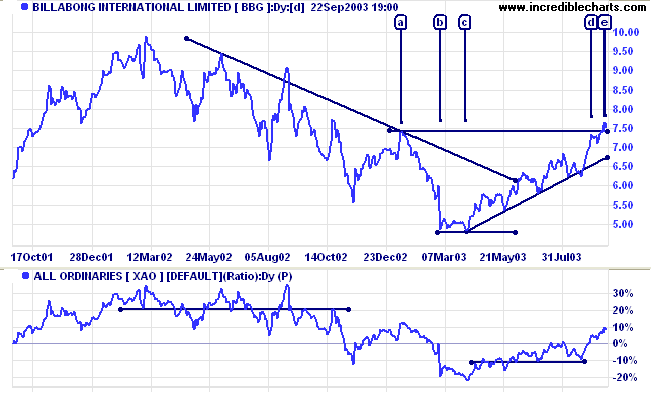
After a lengthy stage 4 down-trend BBG formed a narrow bottom at [b] and [c] before commencing a strong secondary rally.
When Relative Strength started to rise my expectations were that the rally would fail, and re-test support at 5.00, because of the narrow base. Hence my earlier comment about predictions: there are no certainties, only probabilities.
The rally has reached the first major resistance level at 7.50, near the high of [a]. After a short, bullish correction after [d], price broke through resistance at [e].
Last covered August 23, 2002.
After a lengthy stage 4 down-trend BBG formed a narrow bottom at [b] and [c] before commencing a strong secondary rally.
When Relative Strength started to rise my expectations were that the rally would fail, and re-test support at 5.00, because of the narrow base. Hence my earlier comment about predictions: there are no certainties, only probabilities.
The rally has reached the first major resistance level at 7.50, near the high of [a]. After a short, bullish correction after [d], price broke through resistance at [e].
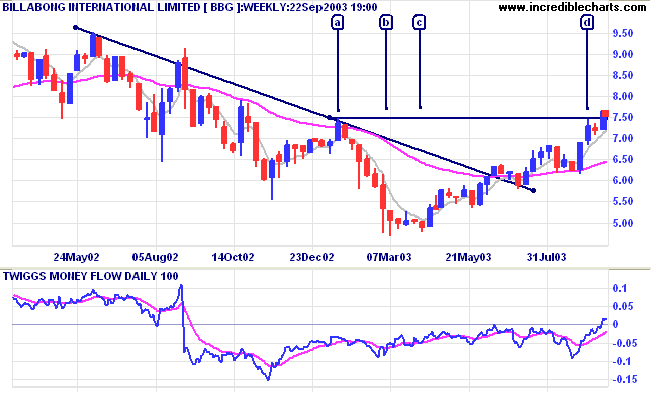
Twiggs Money Flow (100) has risen above zero, to signal
accumulation, after a long period of distribution.
Equivolume shows strong volume on the breakout at [3] and low
volume on the pull-back at [4], a bullish sign. But the dangers
of a retracement back to 5.00 are not completely past. Only when
a pull-back in the intermediate time frame has respected the 7.50
support level, will I forget about the narrow base.
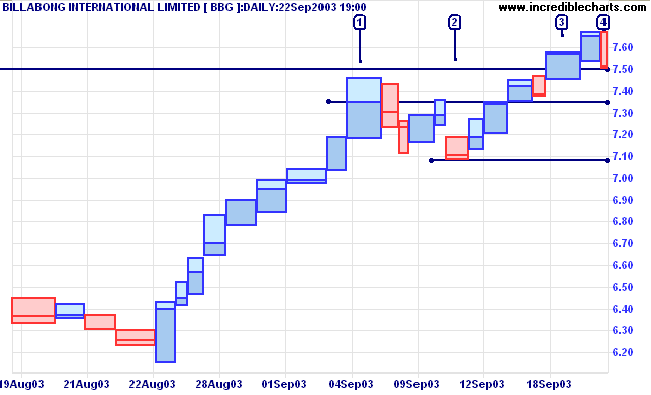
The current, short-term test of support may fall as far as 7.35,
the close of [1], without serious disruption of the
pattern.
A fall below the low of [2] would be bearish.
A fall below the low of [2] would be bearish.
Globe International [GLB]
By contrast, this ASX 300 stock has formed a broad, stable base. Relative Strength and Twiggs Money Flow (100) have both given bullish signals prior to the recent breakout. Prudent traders will wait for a pull-back to support at 0.40 before increasing their positions.
By contrast, this ASX 300 stock has formed a broad, stable base. Relative Strength and Twiggs Money Flow (100) have both given bullish signals prior to the recent breakout. Prudent traders will wait for a pull-back to support at 0.40 before increasing their positions.
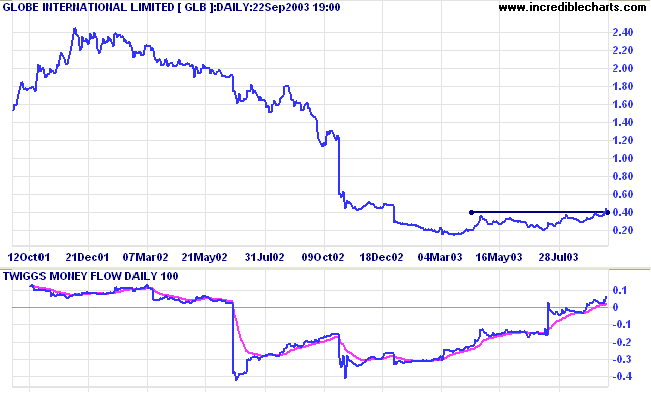
There are often two pull-backs: a short-term pull-back,
immediately after the breakout, and an intermediate term
pull-back which may take several months. Both have to be taken
into account in your trading strategy.
Colin Twiggs
Moderate riches will carry you; if you have
more, you must carry them.
~ SA Nelson: The ABC of Stock Speculation (1903).
~ SA Nelson: The ABC of Stock Speculation (1903).
|
Relative Strength/ Price
Ratio At present the Price Ratio, Price Comparison and Price Differential indicators are calculated using the ratio of closing prices between two securities/indices at the start of the chart. This has confused a number of users because the ratio varies with each chart time-period selected. We are considering changing the formulae, to use the ratio of closing prices at the start of the data: the first day on which both closing prices are quoted. If you would like to express your opinion on the subject, please post at Chart Forum: Indicators |
Back Issues
You can now view back issues at the Daily Trading Diary Archives.
You can now view back issues at the Daily Trading Diary Archives.
Back Issues
Access the Trading Diary Archives.

Author: Colin Twiggs is a former investment banker with almost 40 years of experience in financial markets. He co-founded Incredible Charts and writes the popular Trading Diary and Patient Investor newsletters.
Using a top-down approach, Colin identifies key macro trends in the global economy before evaluating selected opportunities using a combination of fundamental and technical analysis.
Focusing on interest rates and financial market liquidity as primary drivers of the economic cycle, he warned of the 2008/2009 and 2020 bear markets well ahead of actual events.
He founded PVT Capital (AFSL No. 546090) in May 2023, which offers investment strategy and advice to wholesale clients.