| Incredible Charts version 4.0.2.300 |
| The new version will be released this week. Changes include a revised watchlist and securities menu, enabling the addition of ETOs, warrants and US stocks, and a new printer module, with greater printer compatibility and functionality. |
Trading Diary
August 14, 2003
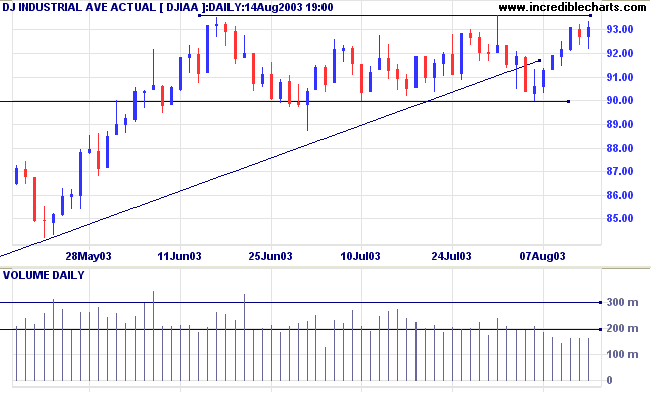
The intermediate trend is up. The index is consolidating between 9000 and 9300.
The primary trend is up.
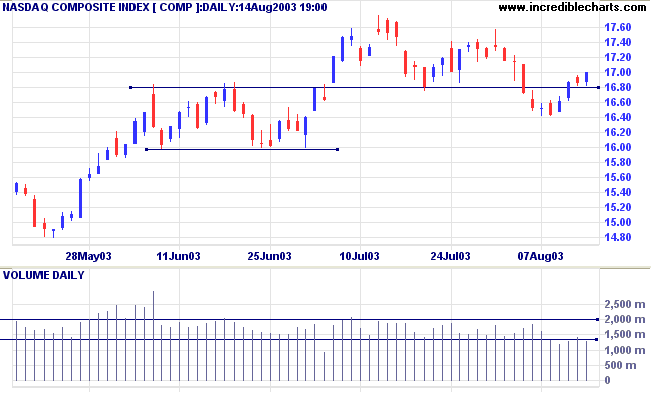
The intermediate trend is down.
The primary trend is up.
The intermediate trend is down.
The primary trend is up.
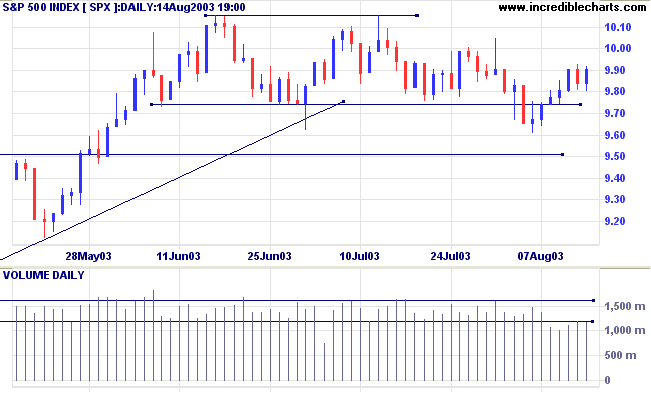
Short-term: Long if the S&P500 is above 1000. Short if below 980.
Intermediate: Long if S&P 500 is above 1015. Short if below 980.
Long-term: Long is the index is above 950.
Spare capacity means that increased production will not immediately kick-start the much-awaited recovery, with increased employment and higher prices. (more)
New unemployment claims reached a higher-than-expected 398,000 last week. (more)
The yield on 10-year treasury notes continues to strengthen, reaching 4.59%.
The intermediate and primary trends are up.
New York (16.56): Spot gold rallied to $365.00.
The primary trend is still upwards.
The intermediate trend is up.
The primary trend is up.
Slow Stochastic (20,3,3) is above its signal line; MACD (26,12,9) is above; Twiggs Money Flow shows a bearish divergence but still signals accumulation.
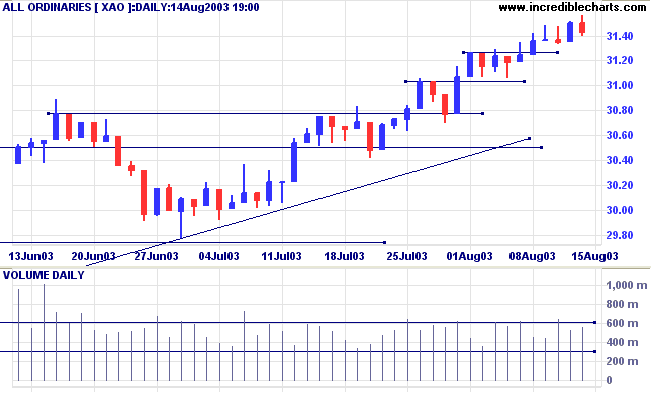
Short-term: Long if the All Ords is above 3150. Short if the intermediate trend turns down.
Intermediate: Long if the index is above 3150.
Long-term: Long if the index is above 2978 .
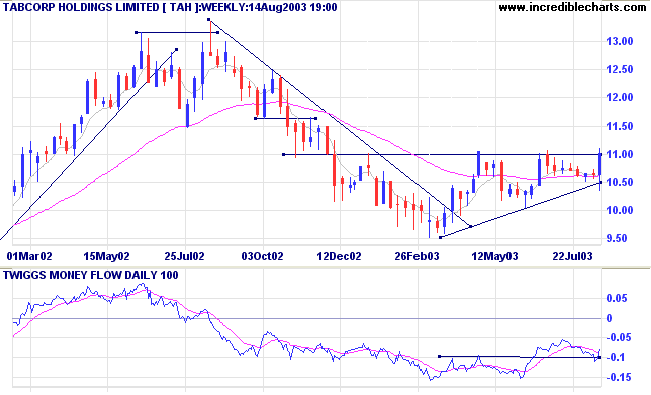
Last covered on May 15, 2003.
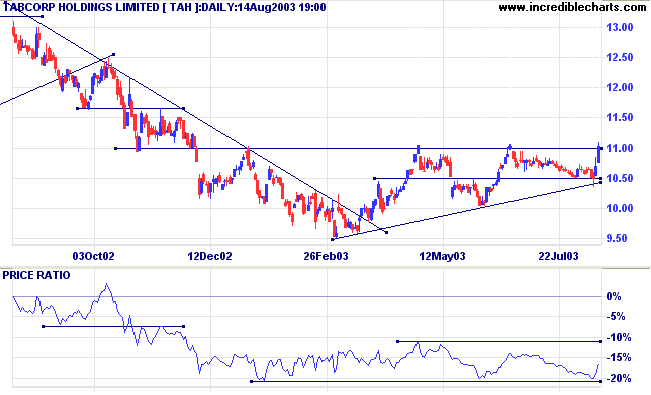
After a double top in 2002 TAH entered a stage 4 decline before leveling out into a stage 1 base in 2003. The base has formed a large bullish ascending triangle with resistance at 11.00.
Twiggs Money Flow (100) is below zero but rising.
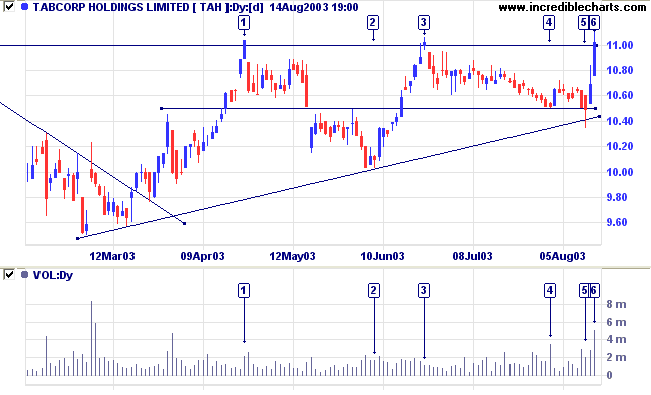
The peak at [3] displays a fall-off in buying pressure; a bearish sign.
Support then forms at 10.50, with high volume on the low at [4] and again at the false break at [5].
The subsequent rise to [6] is accompanied by strong volume. The speed of the rally may exhaust short-term buying pressure and we may observe a short pull-back before the breakout.
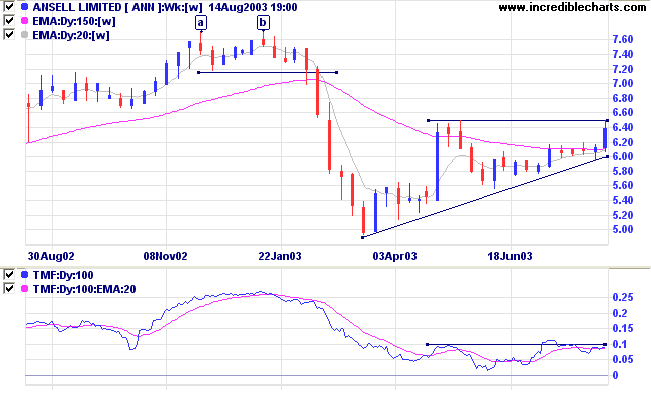
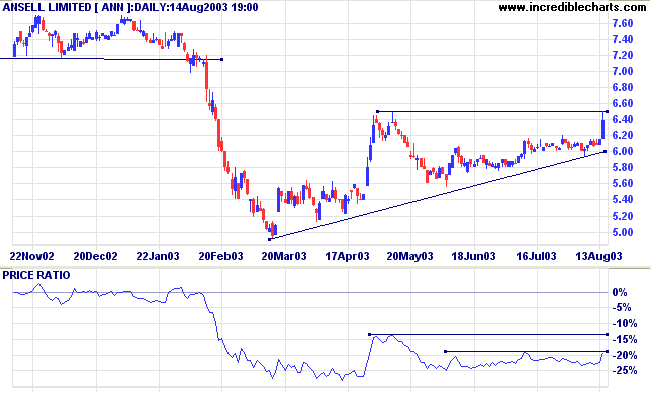
Ansell fell sharply after forming a small double top at [a] and [b], before rallying strongly to create a V-bottom. As is often the case the "V" retreated to re-test support levels. In this case price found support around the 5.60 level and ANN has now formed a bullish ascending triangle.
At what point shall we expect the approach of
danger?
By what means shall we fortify against it?
Shall we expect some transatlantic military giant, to step the
Ocean, and crush us at a blow? Never!
All the armies of Europe, Asia and Africa combined, with all
the treasure of the earth (our own excepted) in their military
chest;
with a Bonaparte for a commander, could not by force, take a
drink from the Ohio,
or make a track on the Blue Ridge, in a trial of a thousand
years.
At what point, then, is the approach of danger to be
expected?
I answer, if it ever reach us it must spring up amongst us. It
cannot come from abroad.
If destruction be our lot, we must ourselves be its author and
finisher.
~ Abraham Lincoln.
| Stock Screening: Breakouts |
|
The % Of Price High filter is excellent
for identifying breakouts, but it also returns stocks that
are already in well-established up-trends. To narrow the
field: (1) Set 3-month % Of Price High to Minimum 100%; (2) Set Directional Movement: ADX (14) Value Filter to Maximum 30; (3) Submit. Combining the two filters should limit the return to recent breakouts. |
You can now view back issues at the Daily Trading Diary Archives.
Back Issues

Author: Colin Twiggs is a former investment banker with almost 40 years of experience in financial markets. He co-founded Incredible Charts and writes the popular Trading Diary and Patient Investor newsletters.
Using a top-down approach, Colin identifies key macro trends in the global economy before evaluating selected opportunities using a combination of fundamental and technical analysis.
Focusing on interest rates and financial market liquidity as primary drivers of the economic cycle, he warned of the 2008/2009 and 2020 bear markets well ahead of actual events.
He founded PVT Capital (AFSL No. 546090) in May 2023, which offers investment strategy and advice to wholesale clients.