|
US stocks Our target is to have NYSE, Nasdaq and Amex charts available by Friday. |
Trading Diary
November 4, 2003
These extracts from my daily trading diary
are for educational purposes
and should not be interpreted as investment
advice. Full terms and conditions can be found at Terms
of Use .
USA
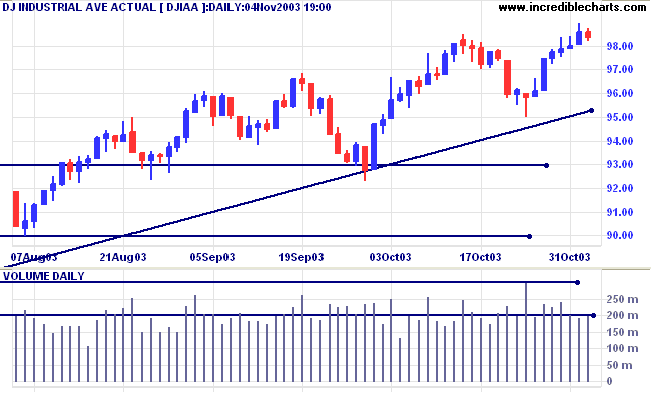
The Dow Industrial Average formed an inside day, closing down at
9839. Low volume signals an absence of selling
pressure.
The intermediate trend is up.
The primary trend is up. A fall below 9000 will signal reversal.
The intermediate trend is up.
The primary trend is up. A fall below 9000 will signal reversal.
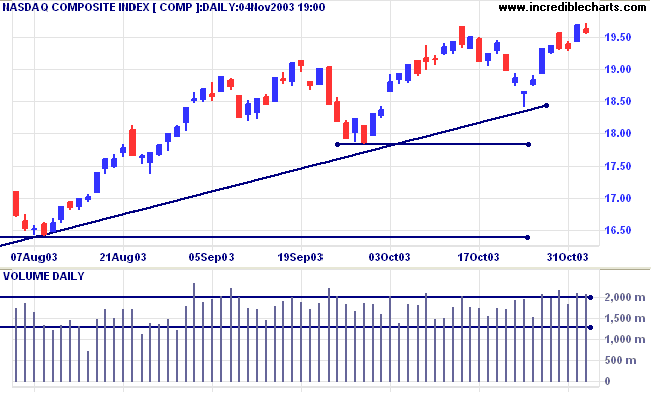
The Nasdaq Composite retreated 10 points to close at 1958. Strong
volume signals selling pressure.
The intermediate trend is up.
The primary trend is up. A fall below 1640 will signal reversal. Expect resistance at 2000.
The intermediate trend is up.
The primary trend is up. A fall below 1640 will signal reversal. Expect resistance at 2000.
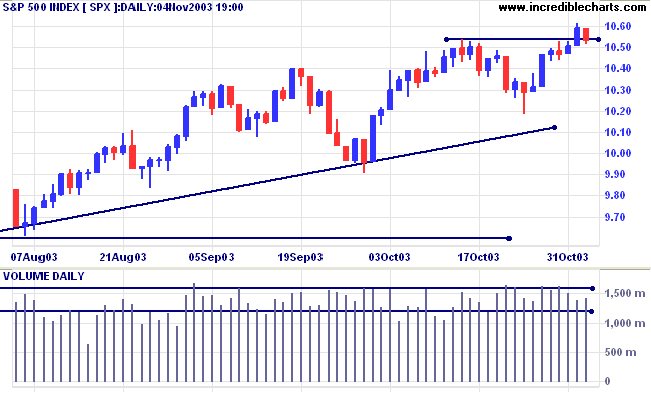
The S&P 500 formed an inside day, closing 6 points lower at
1053 on average volume.
The intermediate trend is up.
The primary trend is up. A fall below 960 will signal reversal.
The intermediate trend is up.
The primary trend is up. A fall below 960 will signal reversal.
The Chartcraft NYSE Bullish % Indicator closed
lower at 81.25% (November 4).
Market Strategy
Short-term: Bullish if the S&P500 is above 1059.
Intermediate: Bullish above 1059.
Long-term: Bullish above 960.
Short-term: Bullish if the S&P500 is above 1059.
Intermediate: Bullish above 1059.
Long-term: Bullish above 960.
More job cuts
The highest level of job cut announcements was recorded since October 2002. Unemployment is still high and many human resource managers do not see a pick-up in hiring until the second quarter of 2004. (more)
The highest level of job cut announcements was recorded since October 2002. Unemployment is still high and many human resource managers do not see a pick-up in hiring until the second quarter of 2004. (more)
Treasury yields
The yield on 10-year treasury notes retreated to 4.30%.
The intermediate down-trend is weak.
The primary trend is up.
The yield on 10-year treasury notes retreated to 4.30%.
The intermediate down-trend is weak.
The primary trend is up.
Gold
New York (17.44): Spot gold recovered to $379.90.
The intermediate trend is up. Price has formed equal highs in the past 6 weeks; a fall below 370.00 will be a bear signal.
The primary trend is up. Expect resistance at 400 to 415.
New York (17.44): Spot gold recovered to $379.90.
The intermediate trend is up. Price has formed equal highs in the past 6 weeks; a fall below 370.00 will be a bear signal.
The primary trend is up. Expect resistance at 400 to 415.
ASX Australia
The All Ordinaries closed 11 points up at 3280. The weak close on
higher volume signals selling pressure.
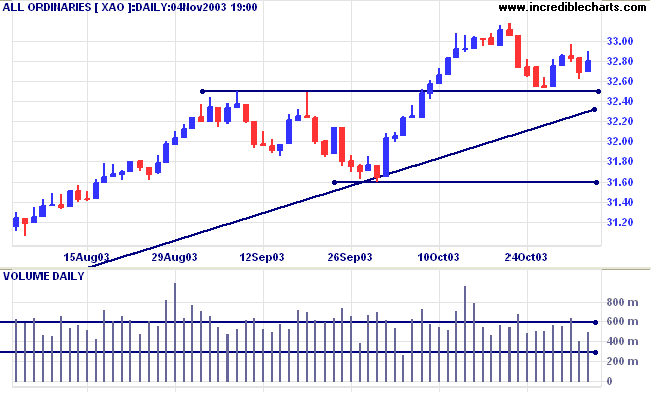
The intermediate up-trend is weak. A fall below 3250 will signal
reversal.
The primary trend is up. The rally is extended and probability of a reversal increases with each successive primary trend movement. A fall below 3160 will signal reversal.
MACD (26,12,9) is below its signal line; Slow Stochastic (20,3,3) is below; Twiggs Money Flow (100) is below its signal line and displays a bearish "triple" divergence.
Market Strategy
Short-term: Bullish if the All Ords is above 3296. Bearish below 3250.
Intermediate: Bullish above 3296.
Long-term: Bullish above 3160.
Short-term: Bullish if the All Ords is above 3296. Bearish below 3250.
Intermediate: Bullish above 3296.
Long-term: Bullish above 3160.
Information Technology
A stock screen of sector indices reveals that IT has out-performed all other sectors of the ASX by a substantial margin over the past 3 months:
A stock screen of sector indices reveals that IT has out-performed all other sectors of the ASX by a substantial margin over the past 3 months:
| Sector Index | %Move(3M) |
|
Information Technology [XIJ] Materials [XMJ] Consumer Discretionary [XDJ] Health Care [XHJ] Industrials [XNJ] Energy [XEJ] Telecom Services [XTJ] Financial-x-Property [XXJ] Consumer Staples [XSJ] Utilities [XUJ] Property Trusts [XPJ] |
59% 14% 10% 7% 5% 2% 1% 0% 0% 0% -4% |
ERG Limited [ERG]
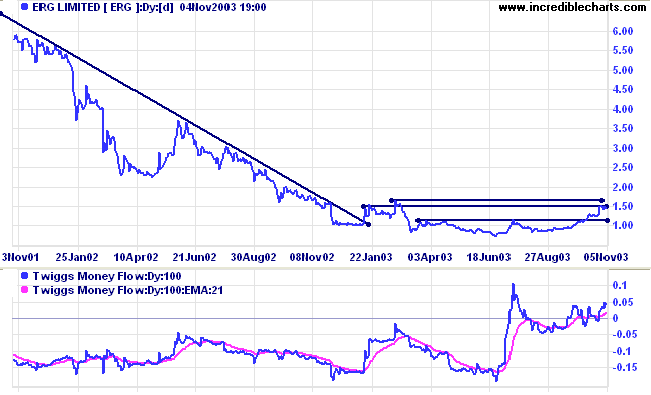
Last covered on October 28, 2003.
ERG has broken out of a broad base and is testing resistance at 1.50 to 1.80. Twiggs Money Flow (100) has climbed above zero to signal accumulation, after a long period of distribution.
Last covered on October 28, 2003.
ERG has broken out of a broad base and is testing resistance at 1.50 to 1.80. Twiggs Money Flow (100) has climbed above zero to signal accumulation, after a long period of distribution.
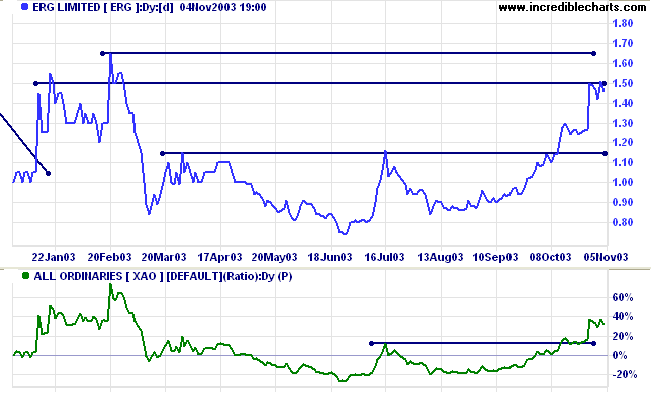
Relative Strength (xao) is rising. It is important that RS
respects the support line on the next pull-back.
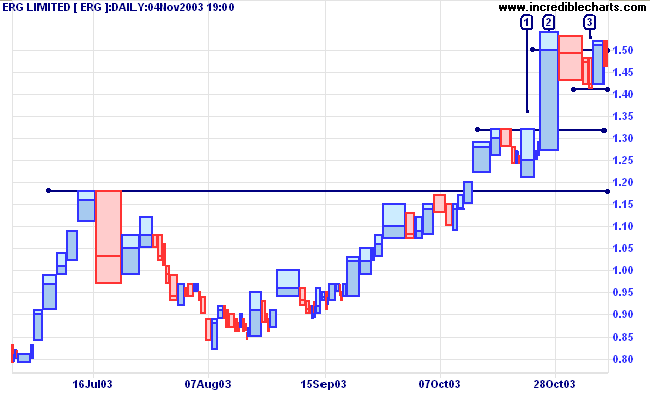
Equivolume is bullish, with a wide gap between the previous high
of [1] and the current low of [3]. Note the dry up of volume and
volatility at [3] presenting an entry opportunity (entries are
taken with a buy-stop above the high and a stop-loss below the
low). This pattern may be repeated before there is a break above
resistance at 1.50. A rise above the high of [2] will add further
confirmation.
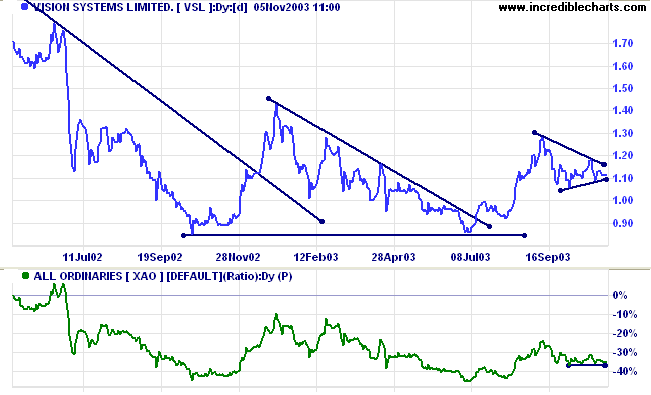
Vision Systems [VSL]
Last covered on September 1, 2003.
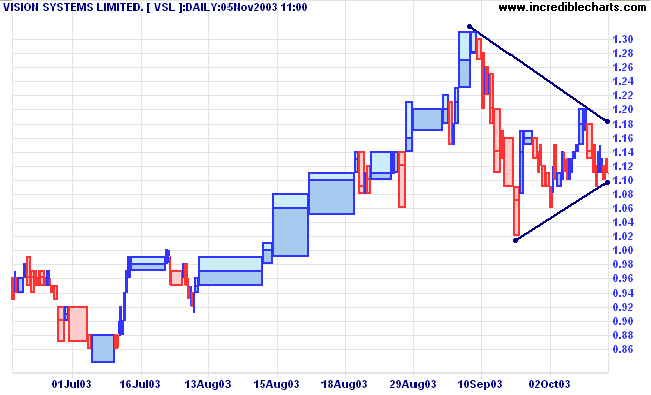
Vision is consolidating after rising off equal lows (July 03 and October 02). The pattern resembles a symmetrical triangle. Twiggs Money Flow (100) signals accumulation.
Last covered on September 1, 2003.
Vision is consolidating after rising off equal lows (July 03 and October 02). The pattern resembles a symmetrical triangle. Twiggs Money Flow (100) signals accumulation.
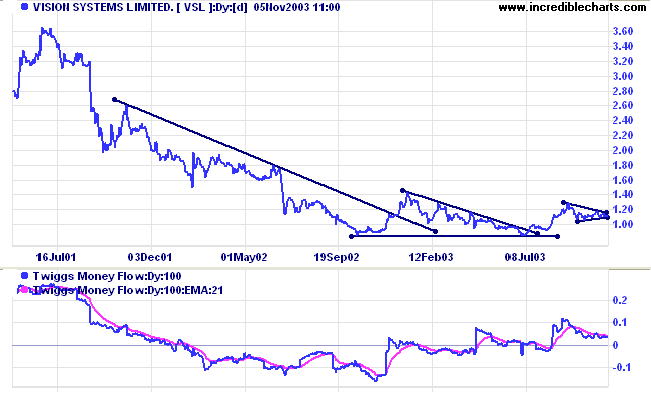
Relative Strength (price ratio: xao) is declining and a fall
through the current support level will be bearish.
Volume has dried up considerably during the consolidation, which
is not unexpected. We will have to wait for a rise above 1.20 or
below 1.06 to provide further clues.
Understanding
the Trading Diary has been expanded to offer further
assistance to readers, including
directions on how to search the archives.
Colin Twiggs
Fame or your health - which is more dear?
Your health or possessions - which is worth more?
Gain or loss - in which is there harm?
~ Lao Tse (c. 300 B.C.)
Your health or possessions - which is worth more?
Gain or loss - in which is there harm?
~ Lao Tse (c. 300 B.C.)
Log scale
|
Sometimes known as a semi-log scale
because only the one axis (price) is calculated
logarithmically. The log scale You may notice that trendlines drawn on a log chart will not display if you switch to normal scale; they would be meaningless. I prefer to draw trendlines on a normal scale. |
Back Issues
You can now view back issues at the Daily Trading Diary Archives.
You can now view back issues at the Daily Trading Diary Archives.
Back Issues
Access the Trading Diary Archives.

Author: Colin Twiggs is a former investment banker with almost 40 years of experience in financial markets. He co-founded Incredible Charts and writes the popular Trading Diary and Patient Investor newsletters.
Using a top-down approach, Colin identifies key macro trends in the global economy before evaluating selected opportunities using a combination of fundamental and technical analysis.
Focusing on interest rates and financial market liquidity as primary drivers of the economic cycle, he warned of the 2008/2009 and 2020 bear markets well ahead of actual events.
He founded PVT Capital (AFSL No. 546090) in May 2023, which offers investment strategy and advice to wholesale clients.