|
Incredible Charts version
4.0.2.600 See What's New for details. Check Help >> About to ensure that you have received the automatic update. |
Trading Diary
October 23, 2003
These extracts from my daily trading diary
are for educational purposes
and should not be interpreted as investment
advice. Full terms and conditions can be found at Terms
of Use .
USA
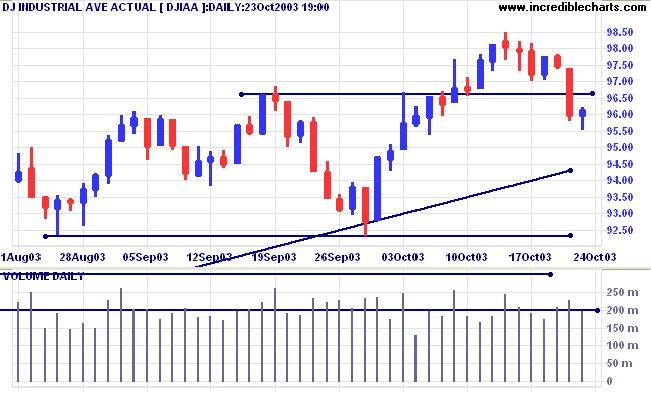
The Dow Industrial Average recovered slightly to 9613 on low
volume.
The intermediate trend is down. Support is at 9230.
The primary trend is up. A fall below 9000 will signal reversal.
The intermediate trend is down. Support is at 9230.
The primary trend is up. A fall below 9000 will signal reversal.
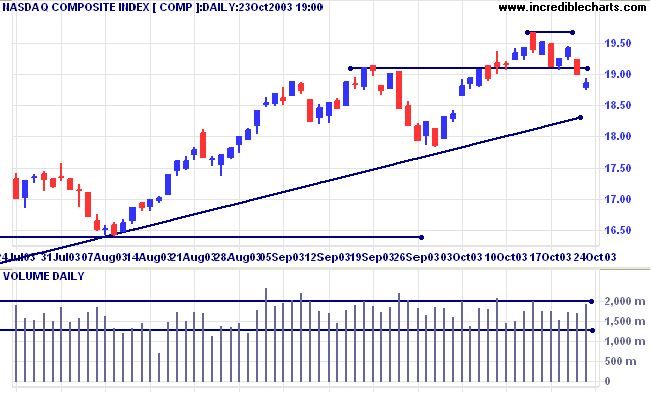
The Nasdaq Composite recovered slightly in a late rally to close
12 points down at 1886 on higher volume.
The intermediate trend is down. Support is at 1783.
The primary trend is up. A fall below 1640 will signal reversal.
The intermediate trend is down. Support is at 1783.
The primary trend is up. A fall below 1640 will signal reversal.
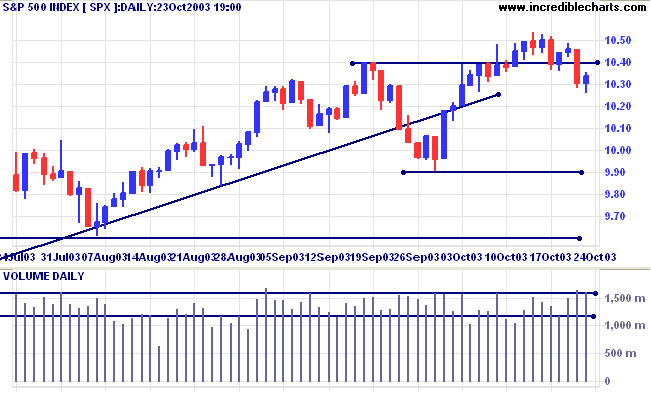
The S&P 500 recovered 4 points to close at 1034 on strong
volume.
The intermediate trend is down. Support is at 990.
The primary trend is up. A fall below 960 will signal reversal.
The intermediate trend is down. Support is at 990.
The primary trend is up. A fall below 960 will signal reversal.
The Chartcraft NYSE Bullish % Indicator fell to
80.57% (October 23).
Market Strategy
Short-term: Bearish if the S&P500 is below 1036.
Intermediate: Bullish above 1054.
Long-term: Bullish above 960.
Short-term: Bearish if the S&P500 is below 1036.
Intermediate: Bullish above 1054.
Long-term: Bullish above 960.
Jobless claims lower
New unemployment claims were lower at 386,000 last week. (more)
New unemployment claims were lower at 386,000 last week. (more)
Treasury yields
The yield on 10-year treasury notes rallied to 4.32%.
The intermediate trend is up. Expect resistance at 4.60%, support at 4.25%.
The primary trend is up.
The yield on 10-year treasury notes rallied to 4.32%.
The intermediate trend is up. Expect resistance at 4.60%, support at 4.25%.
The primary trend is up.
Gold
New York (19:12) Spot gold eased slightly to $384.70.
The intermediate trend has turned up.
The primary trend is up.
New York (19:12) Spot gold eased slightly to $384.70.
The intermediate trend has turned up.
The primary trend is up.
ASX Australia
The All Ordinaries fell sharply after the reversal on US markets,
closing 31 points down at 3274 on strong volume.
Initial support is at 3250.
Initial support is at 3250.
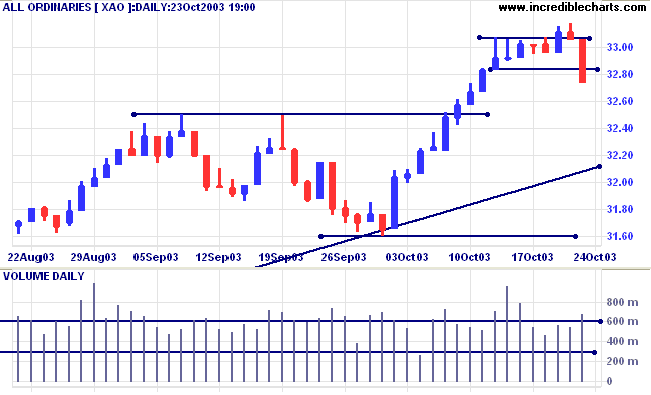
The intermediate trend is weak.
The primary trend is up. A fall below 3160 will signal reversal.
MACD (26,12,9) is above its signal line; Slow Stochastic (20,3,3) is below; Twiggs Money Flow (100) is below its signal line, displaying a bearish "triple" divergence.
The primary trend is up. A fall below 3160 will signal reversal.
MACD (26,12,9) is above its signal line; Slow Stochastic (20,3,3) is below; Twiggs Money Flow (100) is below its signal line, displaying a bearish "triple" divergence.
Market Strategy
Short-term: Bullish if the All Ords is above 3317. Bearish below 3283.
Intermediate: Bullish above 3317.
Long-term: Bullish above 3160.
Short-term: Bullish if the All Ords is above 3317. Bearish below 3283.
Intermediate: Bullish above 3317.
Long-term: Bullish above 3160.
Energy [XEJ]
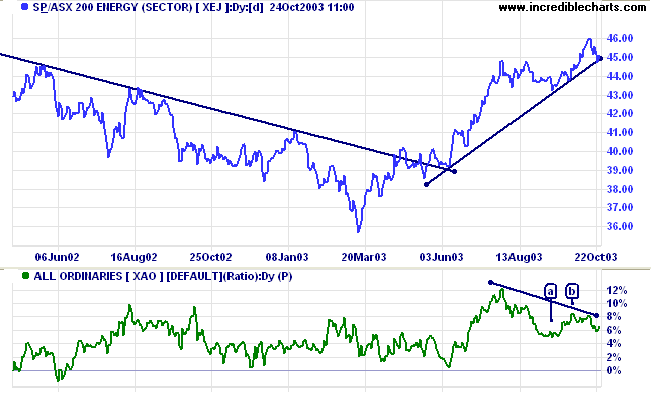
The sector index formed a V-bottom in March followed by a strong rally. The up-trend has now broken below its trendline, signaling weakness.
Relative Strength (price ratio: xao) displays a bearish divergence; a fall below the low of [a] will be a strong bear signal. A rise above the high of [b] will be bullish.
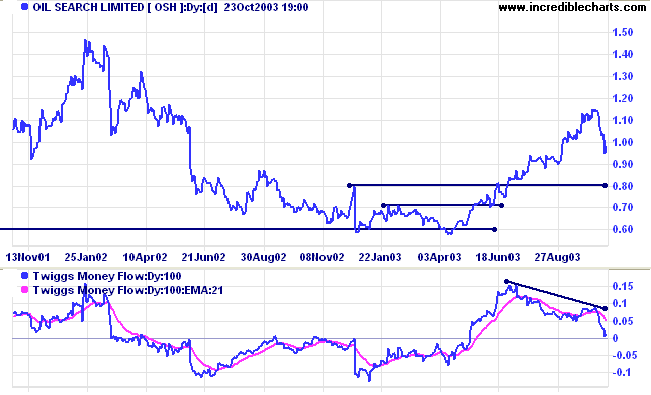
Oil Search [OSH] was last covered on August 7, 2003.
Price has corrected strongly towards support at 0.80. Twiggs Money Flow (100) displays a strong bearish divergence.
Price has corrected strongly towards support at 0.80. Twiggs Money Flow (100) displays a strong bearish divergence.
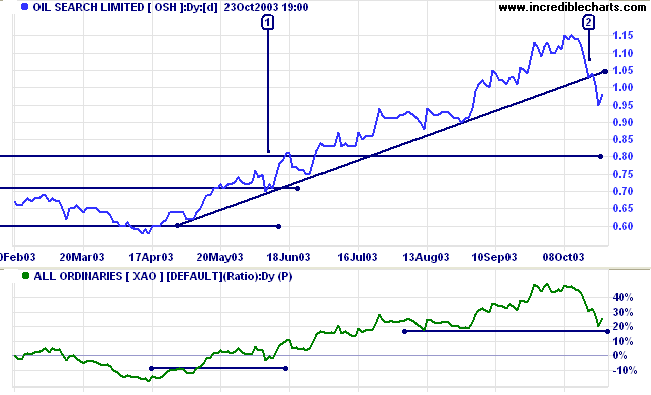
Relative Strength (price ratio: xao) is declining after a strong
rise. The short consolidation at the trendline at [2] gave a bear
signal ahead of the trendline break. This may well be a secondary
correction, but a break of RS below its August low would be a
strong bear signal, as would a close below support at 0.80.
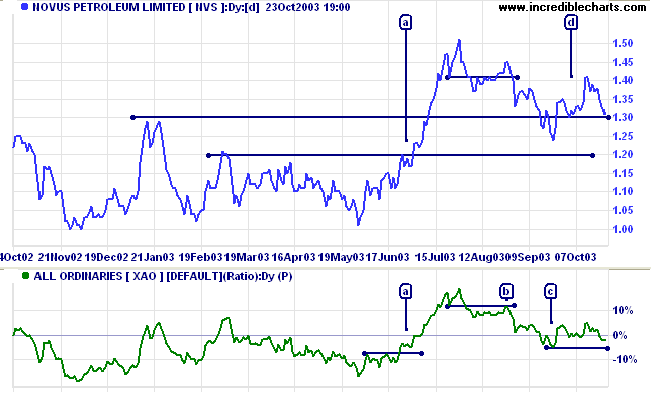
Novus Petroleum [NVS] last covered October 14, 2003.
Novus is testing support after rallying off the recent low. If price respects support at 1.30 and Relative Strength (price ratio: xao) holds above the low of [c] this will be a bull signal. The target would be resistance at 1.50.
Novus is testing support after rallying off the recent low. If price respects support at 1.30 and Relative Strength (price ratio: xao) holds above the low of [c] this will be a bull signal. The target would be resistance at 1.50.
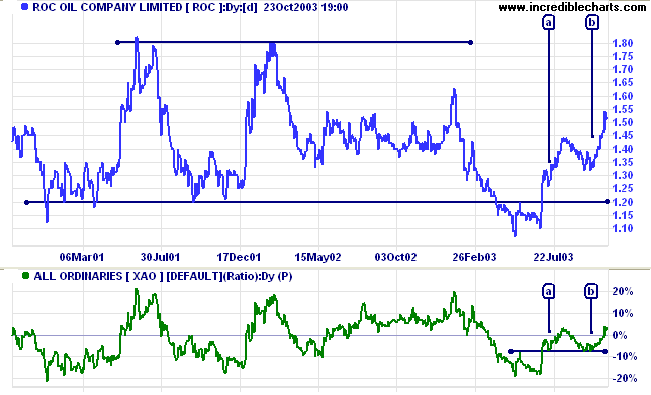
ROC Oil [ROC] last covered July
10, 2003.
Relative Strength (xao) has given two accumulation signals at [a] and [b], respecting support from the previous RS high.
Relative Strength (xao) has given two accumulation signals at [a] and [b], respecting support from the previous RS high.
Understanding
the Trading Diary has been expanded to offer further
assistance to readers, including
directions on how to search the archives.
Colin Twiggs
If the weather men can't predict the weather for
the next day in Florida,
which they can't seem to do with any accuracy despite all their fancy scientific instruments,
what makes people think they can predict where the market will be a month from now?
I think that the greatest misconception about the markets is that you have to be able to call the direction correctly.
Wrong.
Making money in the markets is all about managing risk.
~ Linda Bradford Raschke interview
(with thanks to bookii)
Brokers:
Negotiating the best rates
We have received an excellent response so far.
I will work out a set of criteria to present to brokers.
Please post your suggestions at the above link.
We have received an excellent response so far.
I will work out a set of criteria to present to brokers.
Please post your suggestions at the above link.
Back Issues
You can now view back issues at the Daily Trading Diary Archives.
You can now view back issues at the Daily Trading Diary Archives.
Back Issues
Access the Trading Diary Archives.

Author: Colin Twiggs is a former investment banker with almost 40 years of experience in financial markets. He co-founded Incredible Charts and writes the popular Trading Diary and Patient Investor newsletters.
Using a top-down approach, Colin identifies key macro trends in the global economy before evaluating selected opportunities using a combination of fundamental and technical analysis.
Focusing on interest rates and financial market liquidity as primary drivers of the economic cycle, he warned of the 2008/2009 and 2020 bear markets well ahead of actual events.
He founded PVT Capital (AFSL No. 546090) in May 2023, which offers investment strategy and advice to wholesale clients.