Trading Diary
July 10, 2003
These extracts from my daily trading diary are
intended to illustrate the techniques used in short-term trading
and should not be interpreted as investment advice. Full terms
and conditions can be found at Terms
of Use .
USA
The Dow fell 1.3% to close at 9036 on lower volume.
The intermediate trend is up. A decline below 9000 will signal a down-turn.
The primary trend is up.
The Dow fell 1.3% to close at 9036 on lower volume.
The intermediate trend is up. A decline below 9000 will signal a down-turn.
The primary trend is up.
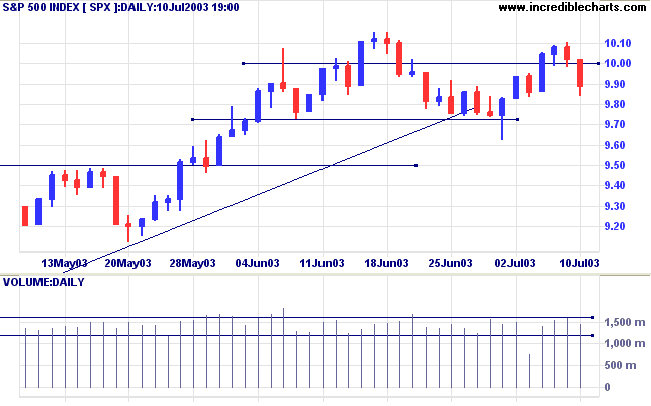
The S&P 500 lost 14 points to close at 988.
The intermediate trend is up. A fall below 982 will signal a down-turn.
The primary trend is up.
The intermediate trend is up. A fall below 982 will signal a down-turn.
The primary trend is up.
The Nasdaq Composite retreated 1.8% to 1715.
The intermediate trend is up.
The primary trend is up.
The intermediate trend is up.
The primary trend is up.
The Chartcraft NYSE Bullish % Indicator rose to
76.14% on July 9.
Market Strategy
Short-term: Long if the S&P 500 is above 1010. Short if the
index falls below 962.
Intermediate: Long if the S&P is above 1010.
Long-term: Long.
Intermediate: Long if the S&P is above 1010.
Long-term: Long.
Jobless claims rise
New unemployment claims increased to 439,000 last week. (more)
New unemployment claims increased to 439,000 last week. (more)
Bank of England cuts rates to 48-year
low
Catching the market by surprise, the BOE cut overnight lending rates by 0.25% to 3.5%. (more)
Catching the market by surprise, the BOE cut overnight lending rates by 0.25% to 3.5%. (more)
Gold
New York (17.22): Spot gold is at $US 345.00.
On the five-year chart gold is above the long-term upward trendline.
New York (17.22): Spot gold is at $US 345.00.
On the five-year chart gold is above the long-term upward trendline.
ASX Australia
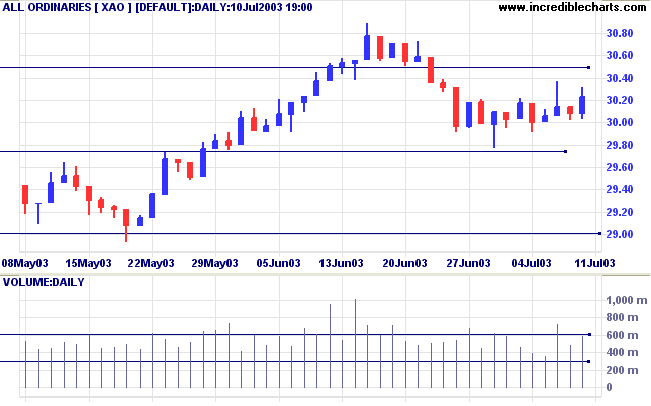
The All Ordinaries rallied to close up 15 points at 3023 on
higher volume.
The negative performance in the US is likely to place a drag on the local market.
The intermediate trend is up.
The primary trend is up.
MACD (26,12,9) is below its signal line; Slow Stochastic (20,3,3) is above; Twiggs Money Flow (21) signals accumulation.
The negative performance in the US is likely to place a drag on the local market.
The intermediate trend is up.
The primary trend is up.
MACD (26,12,9) is below its signal line; Slow Stochastic (20,3,3) is above; Twiggs Money Flow (21) signals accumulation.
Market Strategy
Short-term: Long if the All Ords is above 3032.
Intermediate: The primary trend is up; Long if the All Ords is above 3032.
Long-term: Long.
Intermediate: The primary trend is up; Long if the All Ords is above 3032.
Long-term: Long.
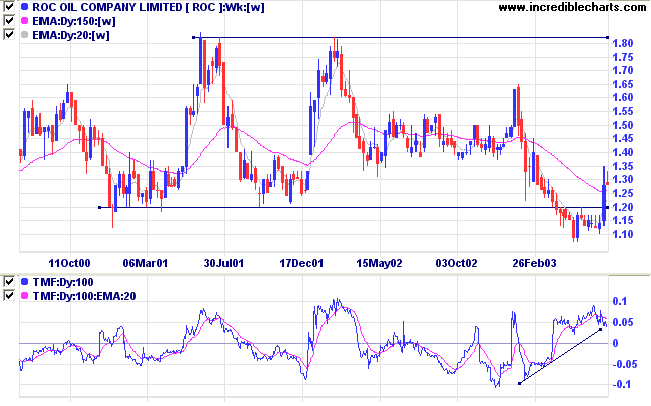
Roc Oil [ROC]
Another Oil & Gas Exploration stock.
ROC has ranged between 1.80 and 1.20 for the last 3 years before a recent downward break in April 2003.
The break may well prove to be a bear trap with ROC having rallied back above the support level on strong volume.
Twiggs Money Flow (100-day) has completed a strong bullish divergence; while MACD is bullish.
Relative Strength (price ratio: xao) has made a new 3-month
high.
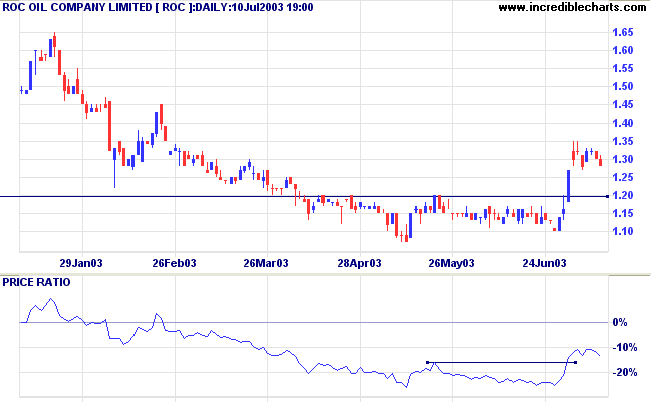
Volume and volatility dried up at [1], when ROC re-tested the
previous low.
Price then rallied, breaking through resistance at [2] on strong volume.
Volume has dried up on the correction, indicating the likelihood of another rally.
Price then rallied, breaking through resistance at [2] on strong volume.
Volume has dried up on the correction, indicating the likelihood of another rally.
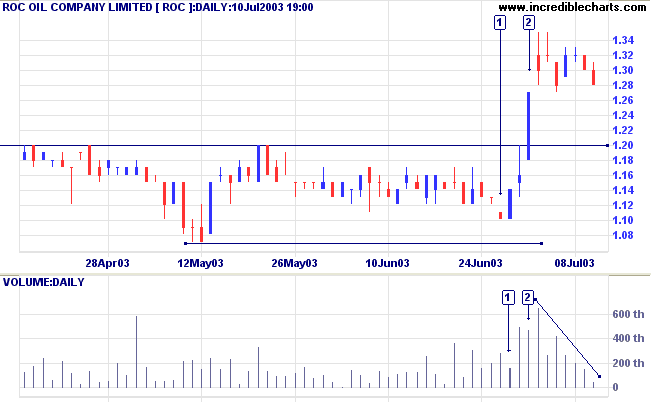
A rise above 1.33 will be a strong bull signal.
A fall below 1.20 would be bearish.
Buy-stops (or sell-stops) are useful tools for timing entries.
Stop losses should always be placed below the most recent Low (or above the most recent High).
The most recent Low will be interpreted differently by traders following the short, intermediate or primary cycles.
New readers: If you trade without stop losses, you are not trading - you are gambling.
Understanding
the Trading Diary has been expanded to offer further
assistance to readers.
Colin Twiggs
Of crimes - none is greater than having the
things that one desires;
Of disasters - none is greater than not knowing when one has enough.
Of defects - none brings more sorrow than the desire for possessions.
The contentment that one has when he knows that he has enough,
is abiding contentment indeed.
~ Lao Tse.
Of disasters - none is greater than not knowing when one has enough.
Of defects - none brings more sorrow than the desire for possessions.
The contentment that one has when he knows that he has enough,
is abiding contentment indeed.
~ Lao Tse.
Stock Screens: New Lows
A stock screen to identify new 3- or 6-month Lows,
is still on our development plan.
I use % Of Price High in its place:
(1) Enter 80 as the 3-month Maximum %; or
(2) Enter 70 as the 6-month Maximum %;
A stock screen to identify new 3- or 6-month Lows,
is still on our development plan.
I use % Of Price High in its place:
(1) Enter 80 as the 3-month Maximum %; or
(2) Enter 70 as the 6-month Maximum %;
(3) Submit.
Back Issues
You can now view back issues at the Daily Trading Diary Archives.
You can now view back issues at the Daily Trading Diary Archives.
Back Issues
Access the Trading Diary Archives.

Author: Colin Twiggs is a former investment banker with almost 40 years of experience in financial markets. He co-founded Incredible Charts and writes the popular Trading Diary and Patient Investor newsletters.
Using a top-down approach, Colin identifies key macro trends in the global economy before evaluating selected opportunities using a combination of fundamental and technical analysis.
Focusing on interest rates and financial market liquidity as primary drivers of the economic cycle, he warned of the 2008/2009 and 2020 bear markets well ahead of actual events.
He founded PVT Capital (AFSL No. 546090) in May 2023, which offers investment strategy and advice to wholesale clients.