|
ETOs and
Warrants ETOs and warrants are now available. The data feed has given us a few problems so this section will remain as beta until we are satisfied that all the bugs have been ironed out. US stocks will follow. |
Trading Diary
October 14, 2003
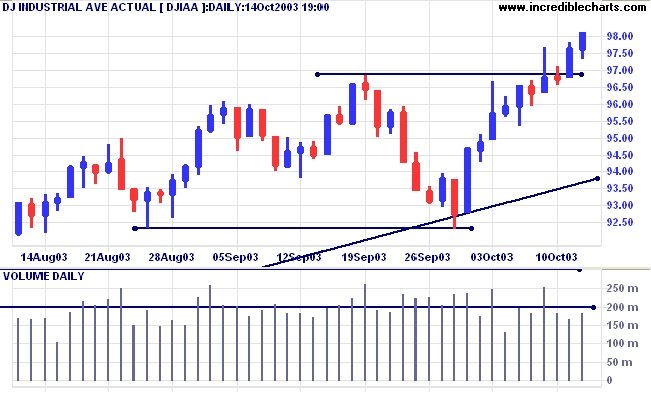
The intermediate trend is up.
The primary trend is up. A fall below 9000 would signal reversal.
The intermediate trend is up.
The primary trend is up.
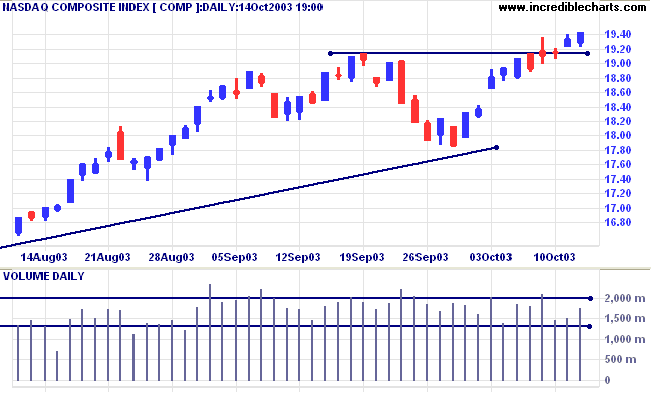
The intermediate trend is up.
The primary trend is up.
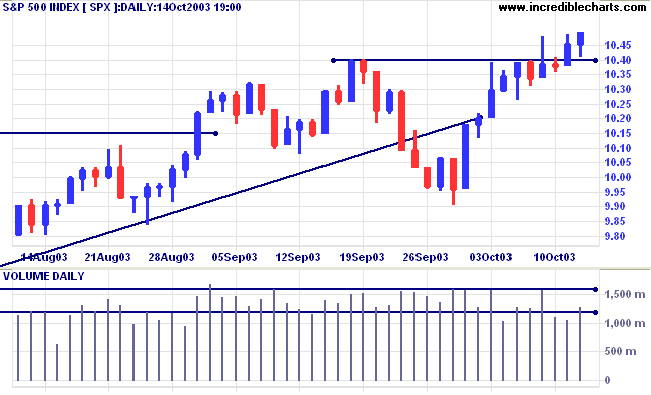
Short-term: Bullish if the S&P500 is above 1040.
Intermediate: Bullish above 1040.
Long-term: Bullish above 990.
The chip maker beat third-quarter earnings estimates, reporting earnings of 25 cents a share and sales up 20% from last year. (more)
The yield on 10-year treasury notes gapped up to 4.35%.
The intermediate trend has turned up.
The primary trend is up.
New York (22:09): Spot gold is up at $374.80.
The intermediate trend is down.
The primary trend is up, with support at 343 to 350.
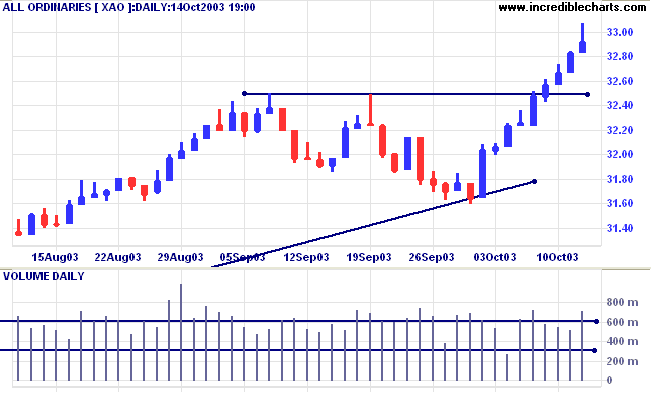
The primary trend is up. The rally is extended after 3 secondary corrections back to the trendline; the probability of a reversal increases with each consecutive (secondary) rally.
MACD (26,12,9) is above its signal line; Slow Stochastic (20,3,3) has crossed to below; Twiggs Money Flow (100) is above its signal line but still displays a bearish divergence.
Short-term: Bullish if the All Ords is above 3307.
Intermediate: Bullish above 3250.
Long-term: Bullish above 3160. Tighten stops (to intermediate level) when the secondary rally ends.
Last covered January 28, 2003.
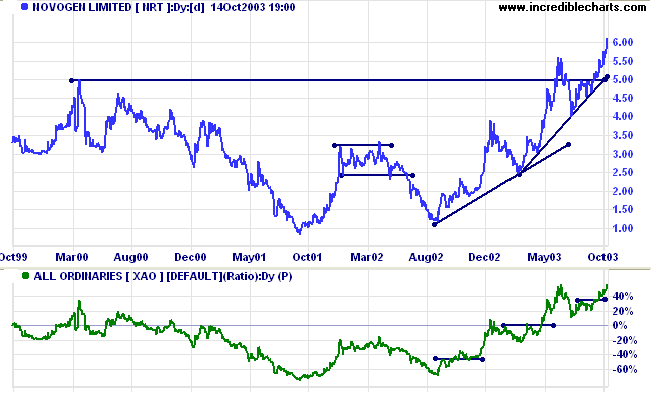
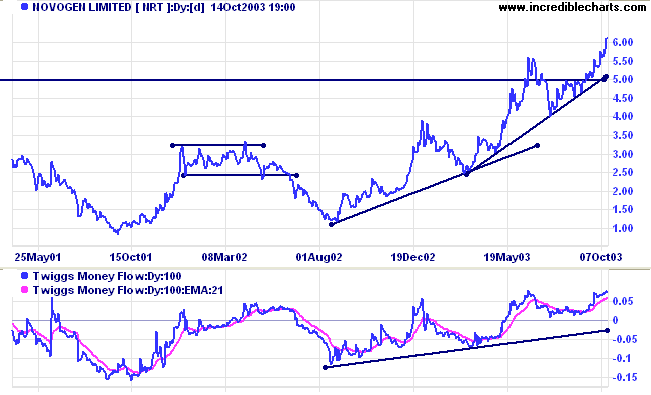
NRT formed a broad double bottom in 2001/02 with a target of 6.00 (3.50 + (3.50 - 1.00)). The target has now been reached after breaking through resistance at 5.00 from an earlier high.
Relative Strength (price ratio: xao) is rising strongly.
With each consecutive secondary correction, the likelihood of a primary reversal increases. Traders should take this into account: now would not be a good time to enter long-term trades.
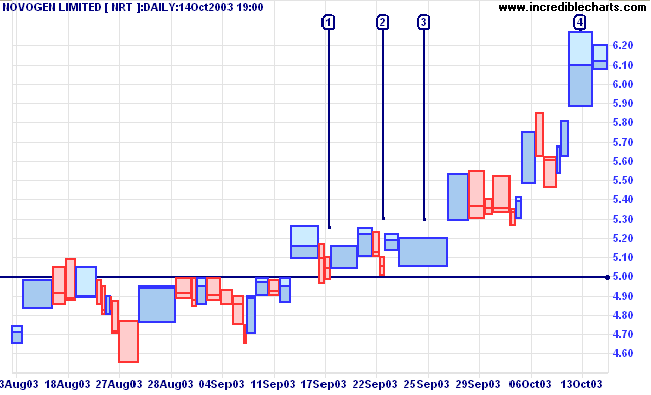
Earlier we can see ideal entry points at [1] and [2]: pull-backs of short duration, with low volatility and volume, respecting a major support level. Entry is taken with a buy-stop above the high.
These are short-term pull-backs and we should still expect a larger correction to test the support level in the intermediate term.
The bar at [3] would also have made a good entry point: price moved lower to test support but then rallied on strong volume to close at the day's high. If there is strong volume on a downward bar that respects the support level, then the close must signal a reversal. Volatility can be either high or low.
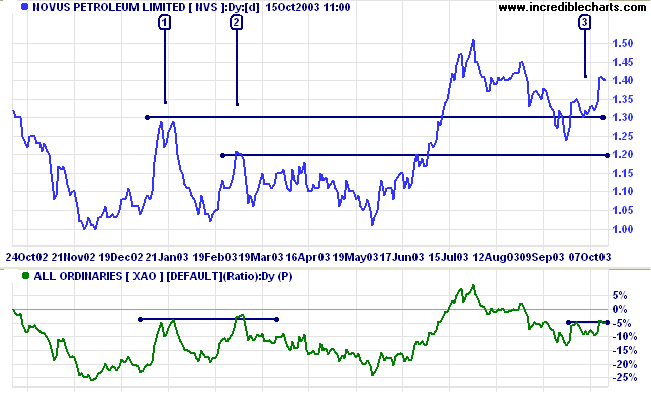
Last covered July 21, 2003.
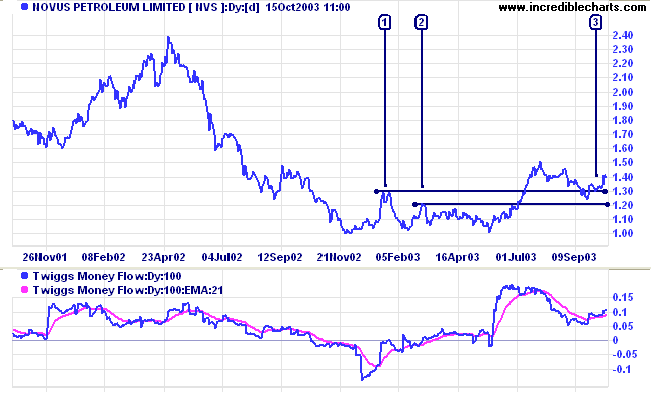
Novus broke out of a broad base before retreating back below support at 1.30, the high of [1]. Price has since respected a secondary support level at the high of [2] before rallying. The latest pull-back at [3] is bullish, again respecting the 1.30 level.
Twiggs Money Flow (100) formed a trough above zero, signaling strong accumulation.
ZIM has consolidated after a healthy up-trend. Relative Strength (price ratio: xao) is falling and threatens to start a down-trend.
A close below 3.75 will be bearish; a rise above 4.74 bullish.

The bigger the top, the bigger the drop
~ Old market maxims.
|
ETOs and warrants are in a separate folder on the
Securities menu: select Securities >> ASX ETOS & WARRANTS to browse through the menu. At this stage, information is limited to Open, High, Low, Close and Volume. We will add further fields as they become available from our data supplier. |
You can now view back issues at the Daily Trading Diary Archives.
Back Issues

Author: Colin Twiggs is a former investment banker with almost 40 years of experience in financial markets. He co-founded Incredible Charts and writes the popular Trading Diary and Patient Investor newsletters.
Using a top-down approach, Colin identifies key macro trends in the global economy before evaluating selected opportunities using a combination of fundamental and technical analysis.
Focusing on interest rates and financial market liquidity as primary drivers of the economic cycle, he warned of the 2008/2009 and 2020 bear markets well ahead of actual events.
He founded PVT Capital (AFSL No. 546090) in May 2023, which offers investment strategy and advice to wholesale clients.
