| Searching the Trading Diary Archives |
Use the normal Search function at the top
of the website page:
EXAMPLE |
Trading Diary
July 21, 2003
The intermediate trend is up. A fall below 8968 will signal a reversal.
The primary trend is up.
The intermediate trend has turned down. MACD shows a bearish divergence.
The primary trend is up.
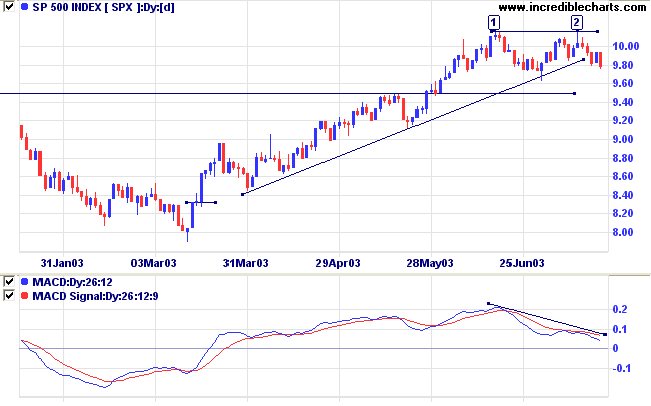
The intermediate trend is up. If price respects support at 1680, this will signal trend strength.
The primary trend is up.
Short-term: Long if the S&P500 is above 1015. Short if below 975.
Intermediate: Long if S&P 500 is above 1015. Short if below 962.
Long-term: Long.
The 10-year note yield climbed 0.2% to 4.19%.
The intermediate trend is up; the primary trend is down.
New York (17.08): Spot gold rallied to $351.60.
The primary trend is up.
The intermediate trend is up.
The primary trend is up (marginally).
Slow Stochastic (20,3,3) has crossed below its signal line; MACD (26,12,9) is above; Twiggs Money Flow signals accumulation.
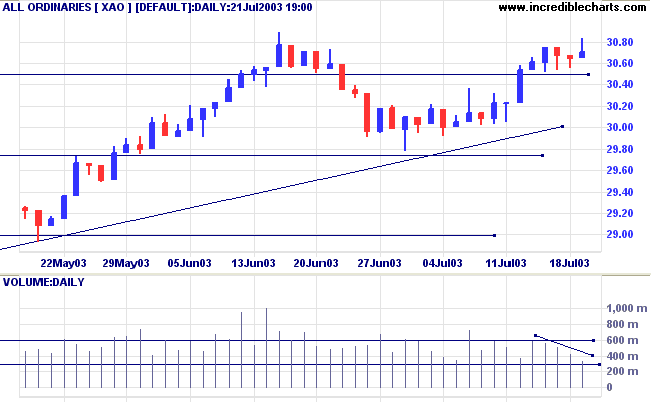
Short-term: Long if the All Ords is above 3075. Short if the index falls below 3050.
Intermediate: Long if the index is above 3075; short if below 2979.
Long-term: Long above 2979.
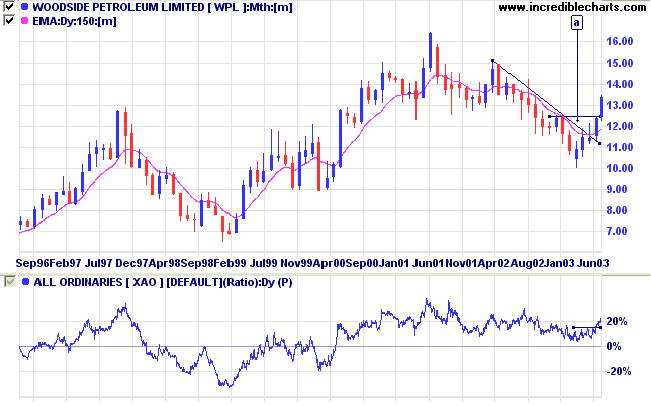
Energy stocks have been rising lately, with 6 of the 7 industry stocks in the ASX 200 recording gains in excess of 10% in the last month.
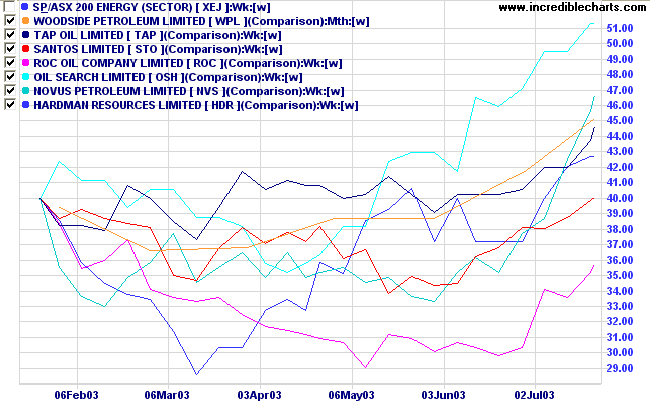

Twiggs Money flow (100) and Relative Strength (price ratio: xao) are rising strongly.
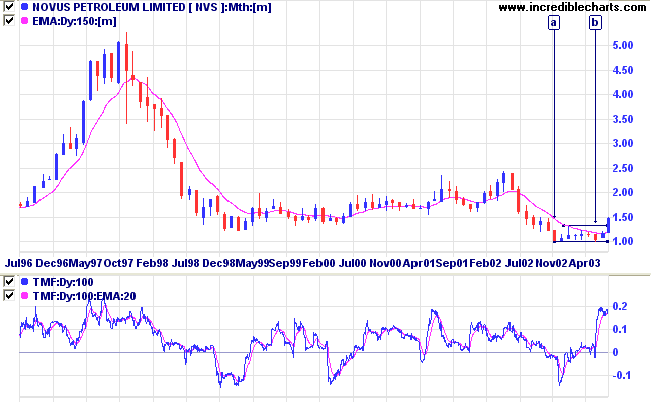
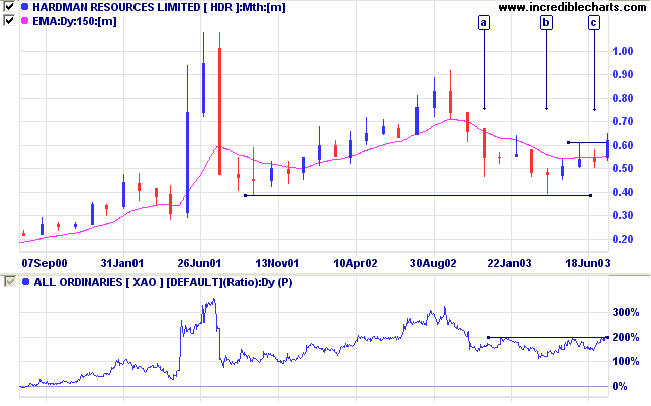
Twiggs Money flow (100) rose to above zero and Relative Strength (price ratio: xao) is bullish.
The meaning of our existence is not
invented by ourselves,
but rather detected.
~ Viktor Frankl: Man's Search For Meaning (1963).
|
Chart Forum: Email Notification by Thread |
|
Members can now elect to receive emails
in respect of a specific thread on the Chart Forum, and
not the entire Topic: (1) Open your Profile; (2) Click the Choose button next to the Topic; (3) Select a specific thread. For example, a member who wants to receive mail from the Melbourne East Trading Group can select Melbourne East, rather than receive mail in respect of every trading group under that topic on the Forum. |
You can now view back issues at the Daily Trading Diary Archives.
Back Issues

Author: Colin Twiggs is a former investment banker with almost 40 years of experience in financial markets. He co-founded Incredible Charts and writes the popular Trading Diary and Patient Investor newsletters.
Using a top-down approach, Colin identifies key macro trends in the global economy before evaluating selected opportunities using a combination of fundamental and technical analysis.
Focusing on interest rates and financial market liquidity as primary drivers of the economic cycle, he warned of the 2008/2009 and 2020 bear markets well ahead of actual events.
He founded PVT Capital (AFSL No. 546090) in May 2023, which offers investment strategy and advice to wholesale clients.
