|
Incredible Charts version 4.0.2.400 (a minor revision) is now available
Check Help >> About to ensure that your version has automatically updated. (1) The new version remembers the last active watchlist that you used, on opening; and (2) It fixes a watchlist scrolling problem reported by some users. See What's New for details. |
Trading Diary
August 27, 2003
The intermediate trend is up. MACD has completed a bearish divergence, signaling weakness.
The primary trend is up.
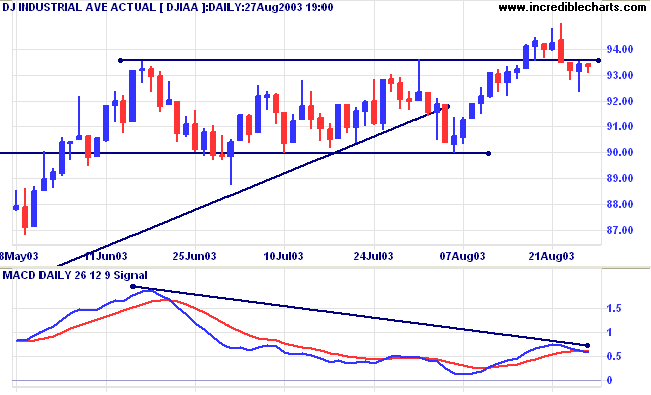
The intermediate trend is up.
The primary trend is up.
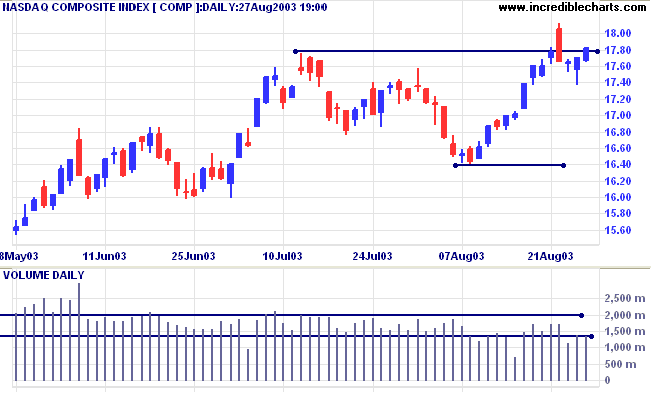
The intermediate trend is down.
The primary trend is up.
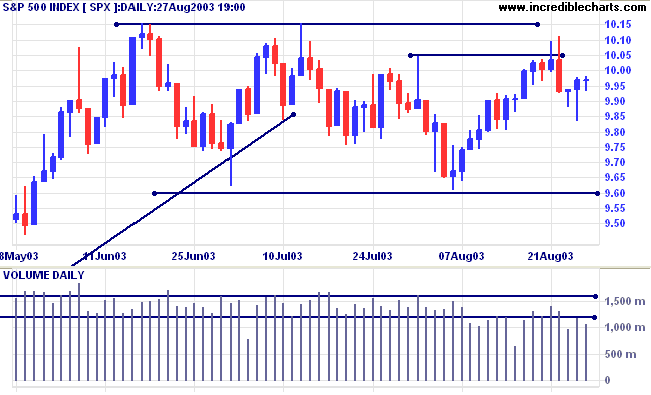
Short-term: Long if the S&P500 is above 1000. Short if below 993.
Intermediate: Long if S&P 500 is above 1015. Short if below 960.
Long-term: Long is the index is above 960.
The International Monetary Fund is reported to be unhappy with the US budget, maintaining that it is too optimistic and lacks coherence. (more)
The National Association of Manufacturers reports that the current recovery is the slowest since that of 1919, with higher costs and a strong dollar inhibiting job creation. (more)
The yield on 10-year treasury notes closed up at 4.54%.
The intermediate and primary trends are both up.
New York (19.12): Spot gold leaped more than 7 dollars to $371.60.
The primary trend is up.
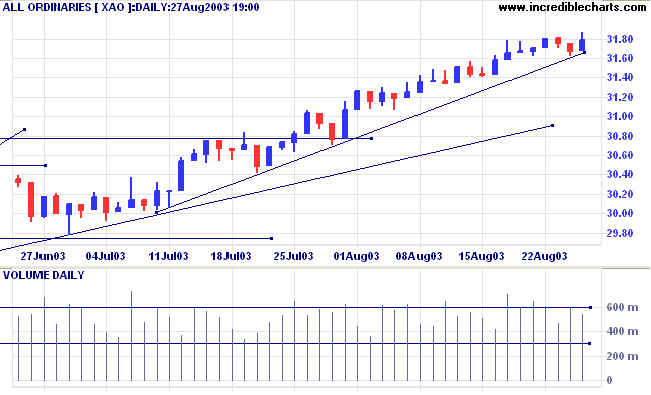
Slow Stochastic (20,3,3) and MACD (26,12,9) are below their signal lines; MACD and Twiggs Money Flow (21) display bearish divergences.
Short-term: Long if the All Ords is above 3187. Short if the intermediate trend reverses.
Intermediate: Long if the index is above 3187.
Long-term: Long positions if the index is above 2978 .
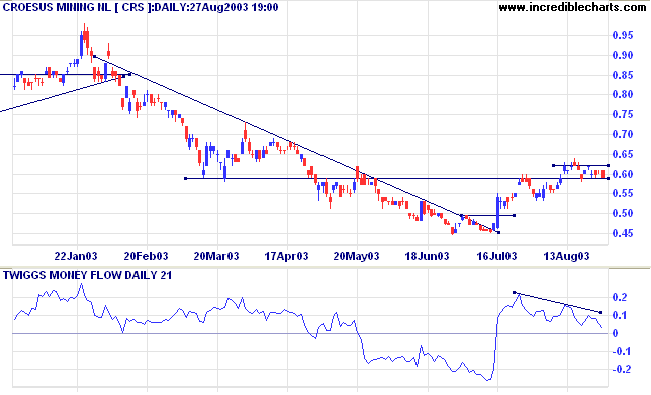
Gold stocks are again under the spotlight after the rise in the spot price. NCM and OXR appear strong but some of the others warrant closer scrutiny.
Support has formed at 0.59; not 0.60 as plotted in the above post.
Twiggs Money Flow (100) and (21) signal bearish divergences but price is consolidating above the support level.
Relative Strength has leveled out, while MACD has crossed below its signal line but is still above zero.
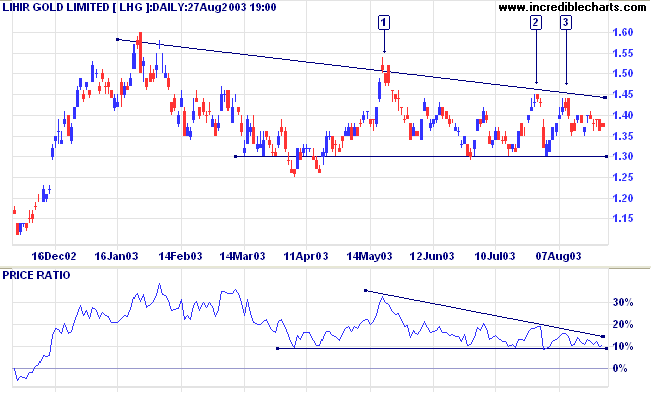
The pull-back to [3] made a false break below the support level. Since then volume has dried up while price has held above 0.59.
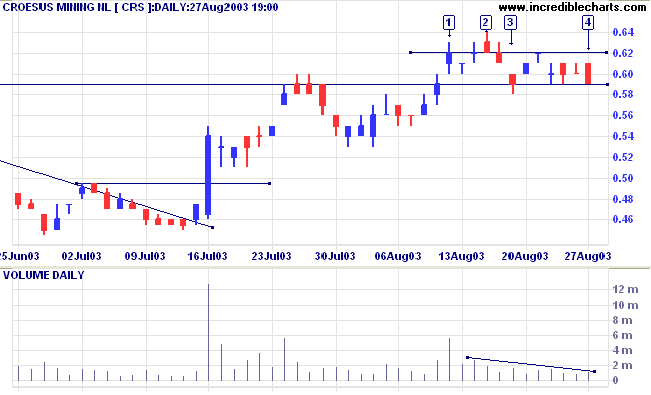
Entries should always be taken using buy-stops/sell-stops above/below the resistance/support levels.
Twiggs Money Flow (100) signals strong accumulation, while the shorter, 21-day indicator shows a bearish divergence.
Relative Strength has yet to make a new 3-month high but MACD is bullish.
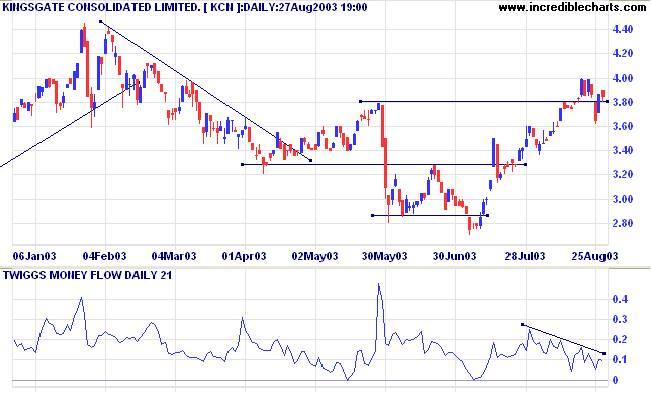
Price appears to be forming a broad stage 3 top, with a large triangle forming since the start of the year.
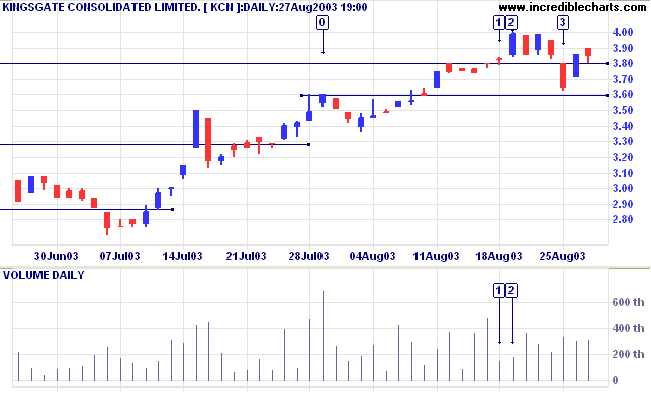
Twiggs Money Flow (100) signals distribution and MACD is weak.
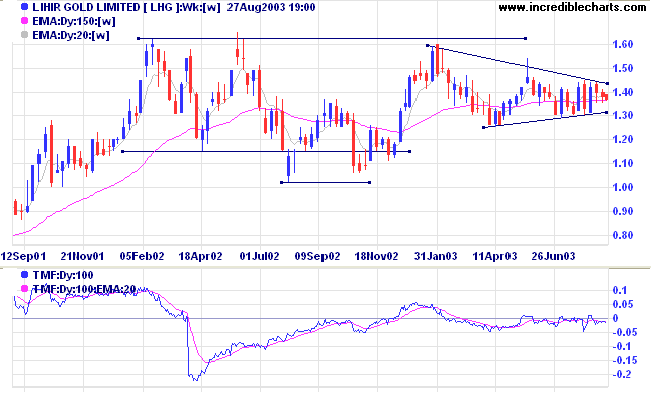
Relative Strength has formed a clear descending triangle, a further bear signal.
You have to be able to control yourself.
You can't let emotions get in the way of your mind
~ Warren Buffett.
We plan to introduce an Advanced Feature with our next update, allowing users to adjust the length of their menus,
thereby reducing the number of sub-folders. You will be able to select a maximum menu length,
between the present 25 and 100. We have to set a maximum, to work within the limitations of Windows operating system.
You can now view back issues at the Daily Trading Diary Archives.
Back Issues

Author: Colin Twiggs is a former investment banker with almost 40 years of experience in financial markets. He co-founded Incredible Charts and writes the popular Trading Diary and Patient Investor newsletters.
Using a top-down approach, Colin identifies key macro trends in the global economy before evaluating selected opportunities using a combination of fundamental and technical analysis.
Focusing on interest rates and financial market liquidity as primary drivers of the economic cycle, he warned of the 2008/2009 and 2020 bear markets well ahead of actual events.
He founded PVT Capital (AFSL No. 546090) in May 2023, which offers investment strategy and advice to wholesale clients.