| Incredible Charts version 4.0.2.300 |
| The new version will be released this week. Changes include a revised watchlist and securities menu, enabling the addition of ETOs, warrants and US stocks, and a new printer module, with greater printer compatibility and functionality. |
Trading Diary
August 12, 2003
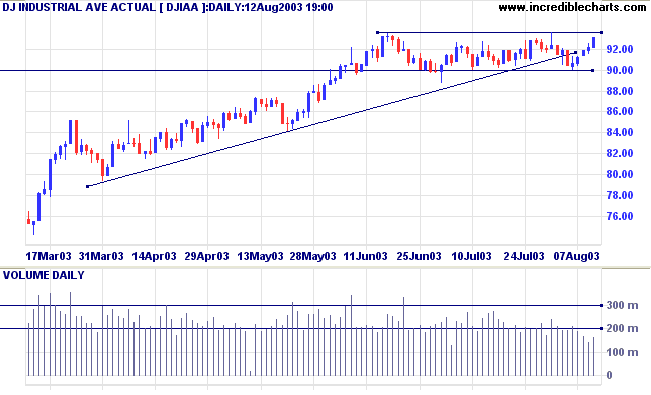
The intermediate trend is up.
The primary trend is up.
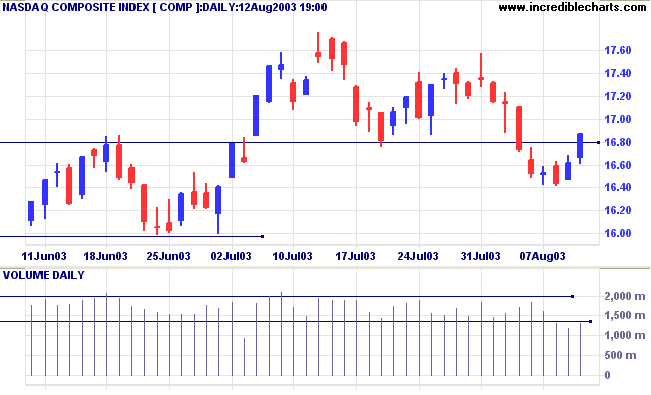
The intermediate trend is down.
The primary trend is up.
The intermediate trend is down.
The primary trend is up.
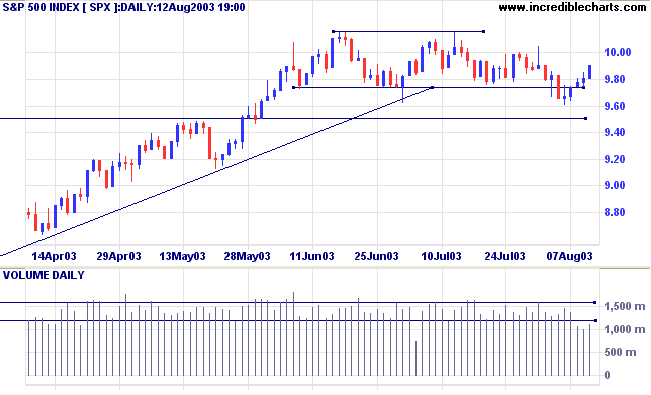
Short-term: Long if the S&P500 is above 1000. Short if below 980.
Intermediate: Long if S&P 500 is above 1015. Short if below 980.
Long-term: Long is the index is above 950.
The Fed left overnight lending rates at 1.0%, saying that it expects economic growth to improve but is concerned by an "unwelcome fall" in already-low inflation. (more)
The yield on 10-year treasury notes closed almost unchanged at 4.36%.
The intermediate and primary trends are both up.
New York (17.18): Spot gold eased to $357.60.
The primary trend is still upwards.
The intermediate trend is up. A fall below 2978 would signal a reversal.
The primary trend is up.
Slow Stochastic (20,3,3) is below its signal line; MACD (26,12,9) is above; Twiggs Money Flow signals accumulation.
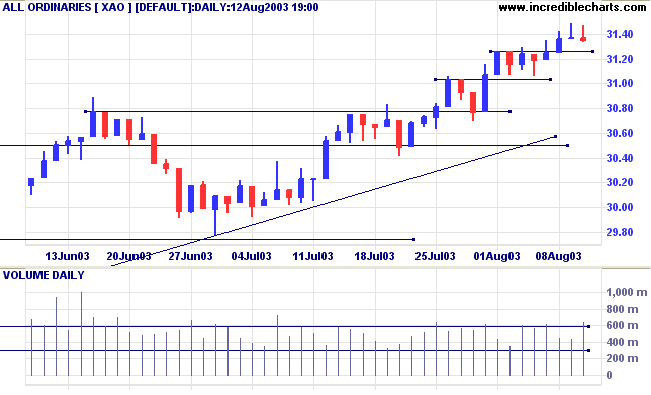
Short-term: Long if the All Ords is above 3149. Short if the intermediate trend turns down.
Intermediate: Long if the index is above 3149.
Long-term: Long if the index is above 2978 .
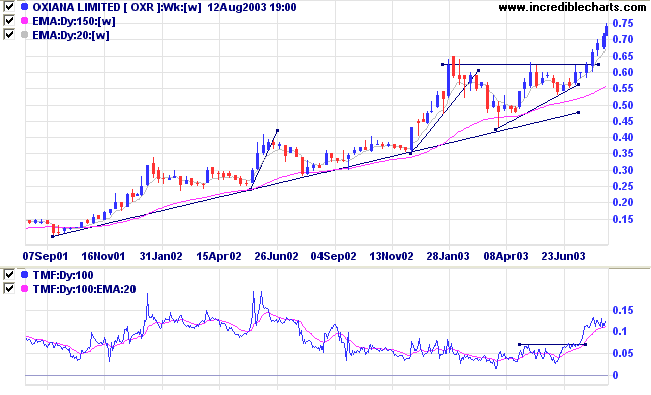
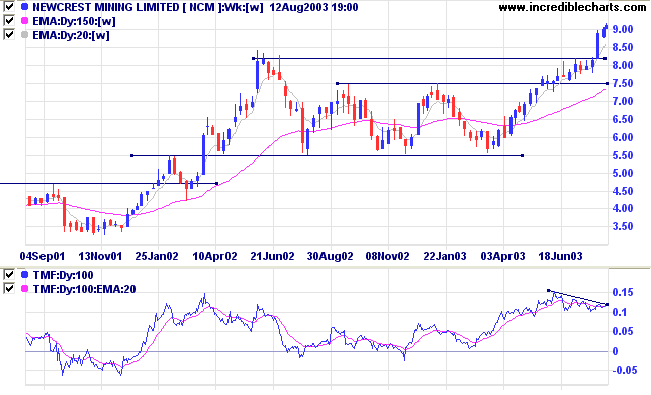
Three gold stocks are making new 3-month highs:
Last covered on July 29, 2003.
Oxiana has broken out from an ascending triangle and has rallied to new highs on strong volume.
Twiggs Money Flow (100) and Relative Strength are bullish.
Last covered on July 29, 2003.
NCM has also broken through resistance to new highs.
Relative Strength and MACD are bullish but Twiggs Money Flow displays a bearish divergence over the past two months.
Lower volume in the last week warns of a possible pull-back to test support levels.
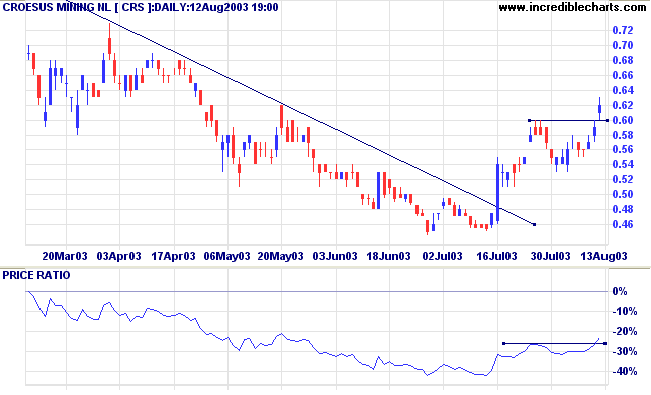
Last covered on February 7, 2003; a good example of why tight stop losses are essential - not every trade goes according to plan.
CRS has since broken above the long-term downward trendline after forming a narrow bottom.
MACD and Twiggs Money Flow (100) are bullish.
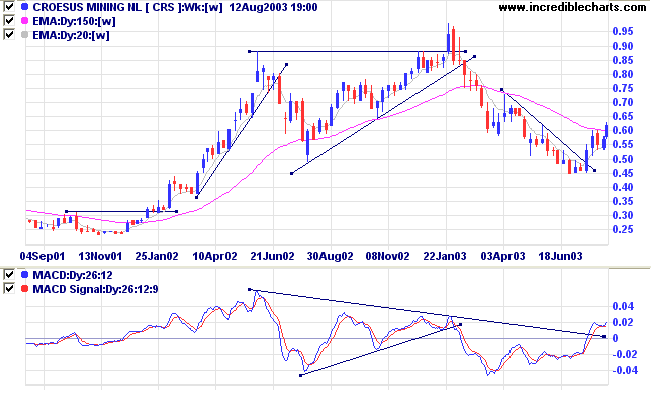
Low volume and weak closes signal a loss of momentum at [3]. But the correction to [4] continued with low volume.
CRS then formed a higher low before rallying above the high of [3] on stronger volume.
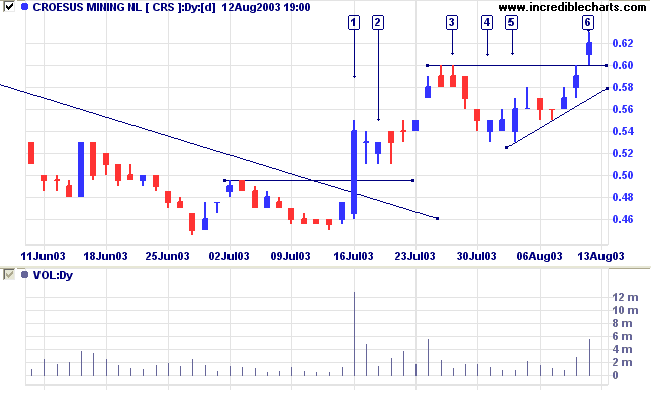
A change in the intermediate trend would be bearish.
Laws Conditional # 7.
I have written to little purpose unless I have left the
impression
that the fundamental principle that lies at the base of all
speculation is this:
Act so as to keep the mind clear, its judgment
trustworthy.
~ SA Nelson: The ABC of Stock Speculation (1903).
| Tip: Coppock Indicator |
|
The long-term, monthly Coppock indicator
is also available in a pre-set file: Select File>>Open Project>>[Coppock Indicator 14_11_10 Months]. The file also includes a daily version of the same indicator. |
You can now view back issues at the Daily Trading Diary Archives.
Back Issues

Author: Colin Twiggs is a former investment banker with almost 40 years of experience in financial markets. He co-founded Incredible Charts and writes the popular Trading Diary and Patient Investor newsletters.
Using a top-down approach, Colin identifies key macro trends in the global economy before evaluating selected opportunities using a combination of fundamental and technical analysis.
Focusing on interest rates and financial market liquidity as primary drivers of the economic cycle, he warned of the 2008/2009 and 2020 bear markets well ahead of actual events.
He founded PVT Capital (AFSL No. 546090) in May 2023, which offers investment strategy and advice to wholesale clients.