| Incredible Charts version 4.0.2.300 |
| Testing is taking longer than expected and the new version should be released in a few days. Changes include a revised watchlist and securities menu, enabling the addition of ETOs, warrants and US stocks, and a new printer module, with greater printer compatibility and functionality. |
Trading Diary
August 18, 2003
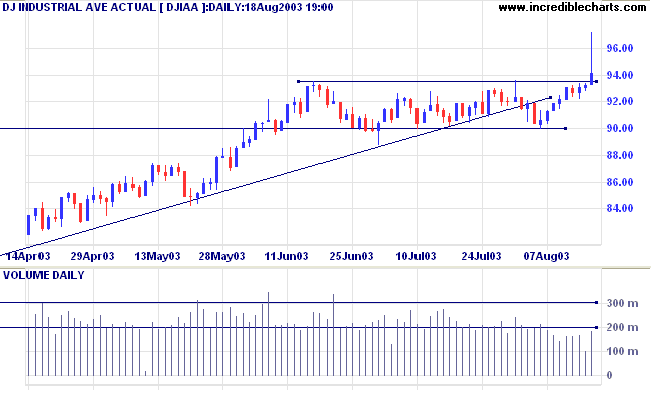
The intermediate trend is up.
The primary trend is up.
The intermediate trend is down, but weakening.
The primary trend is up.
The intermediate trend is down, but weakening.
The primary trend is up.
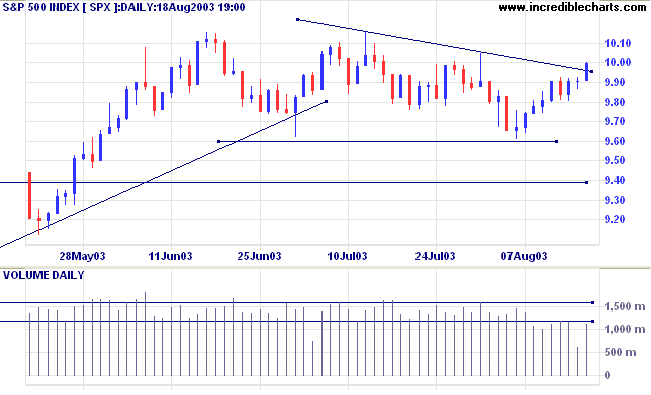
Short-term: Long if the S&P500 is above 1000. Short if below 986.
Intermediate: Long if S&P 500 is above 1015. Short if below 960.
Long-term: Long is the index is above 950.
Home improvement retailer Lowes reports a 28% increase in Q2 earnings and a 6.9% increase in same-store sales. (more)
The largest US retailer reports August sales at the high end of expectations, despite fierce competition. (more)
The yield on 10-year treasury notes closed down slightly at 4.48%.
The intermediate and primary trends are both up.
New York (17.52): Spot gold retreated to $358.20.
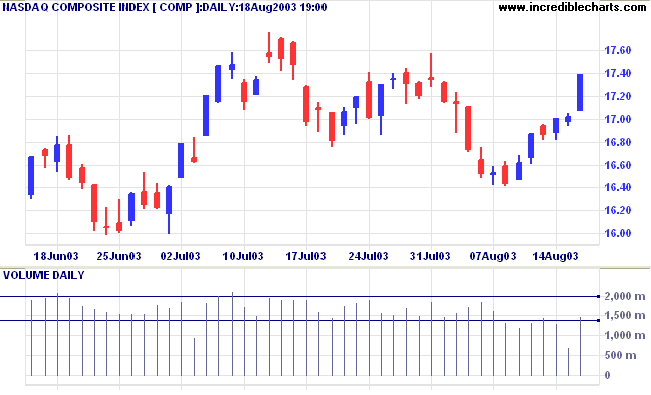
The primary trend is up.
The intermediate trend is up. A fall below 2978 would signal a reversal.
The primary trend is up.
Slow Stochastic (20,3,3) has whipsawed to below its signal line; MACD (26,12,9) is above; Twiggs Money Flow signals accumulation.
MACD and Twiggs Money Flow (21) show bearish divergences.
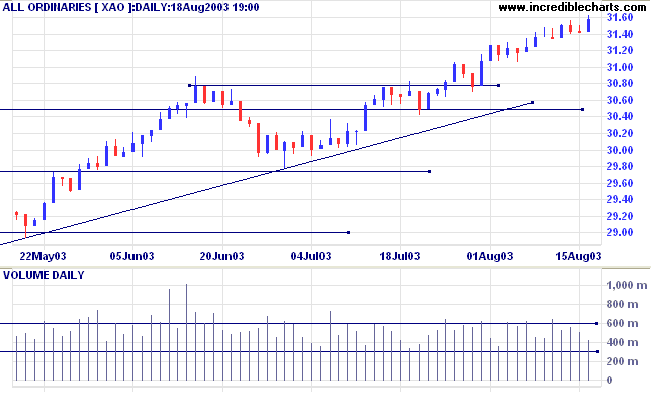
Short-term: Go long if the All Ords is above 3151. Go short if the intermediate trend reverses.
Intermediate: Go long if the index is above 3151.
Long-term: Take long positions if the index is above 2978 .
Last covered on July 29, 2003.
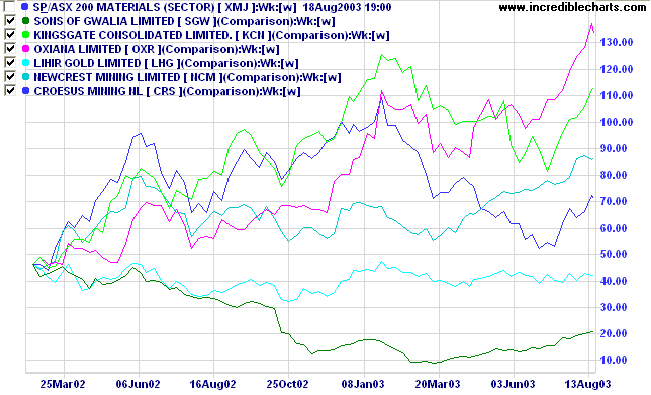
Gold stocks featured strongly in the weekend review, with 7 ASX 200 stocks recording more than 5% growth in the last month. Even Sons of Gwalia appears to be rising off the floor.
Last covered on July 7, 2003. KCN completed a bear trap at [e]. After a false break below support at [d] the stock rallied back strongly to complete a double bottom reversal.
Price has now reached the target at the high of [a].
Twiggs Money Flow (100) continues to signal strong accumulation, while Relative Strength and MACD are bullish.
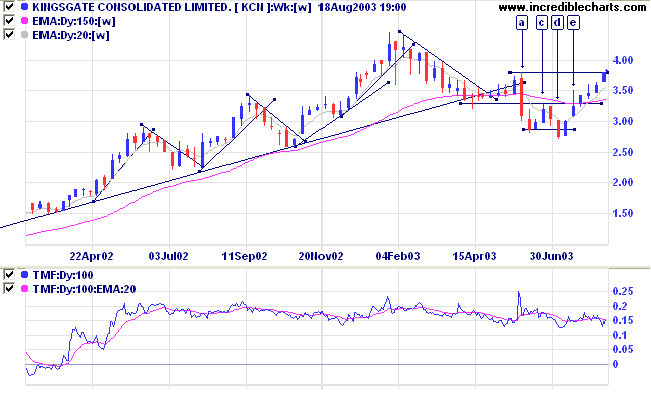
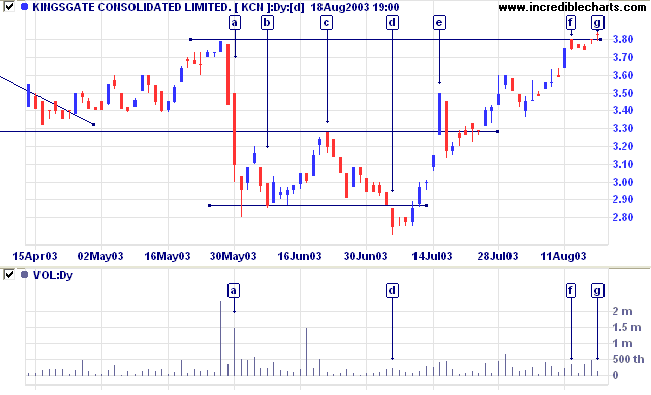
KCN is unlikely to hold above 3.80 and, after the recent false breaks, I will only go long on a pull-back that respects the support level.
A fall below 3.30 would be a strong bear signal.
Last covered on July 23, 2003.
SGW has broken out of a stage 1 base after completing a broad ascending triangle at [d].
Twiggs Money Flow (100) has risen above zero, to signal strong accumulation, while Relative Strength and MACD are bullish.
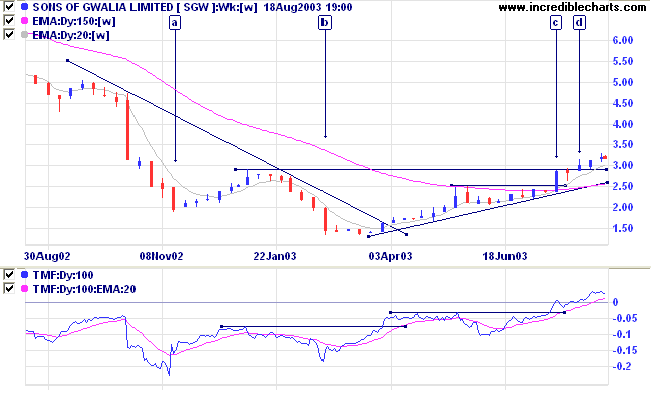
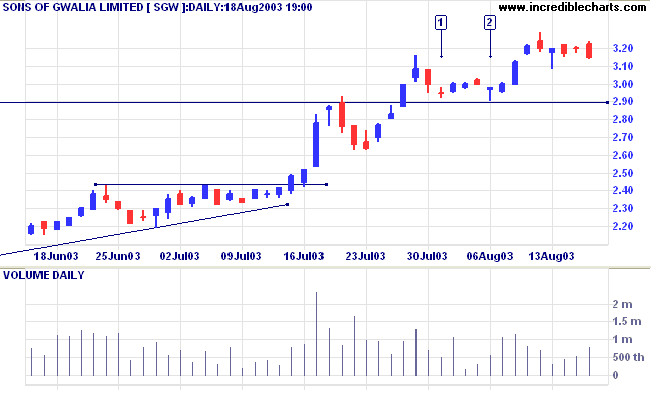
A fall below 2.90 would be bearish.
We stand at the crossroads each minute, each
hour, each day, making choices. We choose the thoughts we allow
ourselves to think, the passions we allow ourselves to feel,
and the actions we allow ourselves to perform. Each choice is
made in the context of whatever value system we've selected to
govern our lives. In selecting that value system, we are, in a
very real way, making the most important choice
we will ever make.
~ Benjamin Franklin.
| Weekly and Monthly Charts |
|
Weekly and monthly data is always
presented as per the calendar. Weeks are calculated from
Monday to Friday and months from the first to the last
trading day of the calendar month. Incomplete weeks and months are only displayed if you select File >> Advanced Features >> Display Part Periods. |
You can now view back issues at the Daily Trading Diary Archives.
Back Issues

Author: Colin Twiggs is a former investment banker with almost 40 years of experience in financial markets. He co-founded Incredible Charts and writes the popular Trading Diary and Patient Investor newsletters.
Using a top-down approach, Colin identifies key macro trends in the global economy before evaluating selected opportunities using a combination of fundamental and technical analysis.
Focusing on interest rates and financial market liquidity as primary drivers of the economic cycle, he warned of the 2008/2009 and 2020 bear markets well ahead of actual events.
He founded PVT Capital (AFSL No. 546090) in May 2023, which offers investment strategy and advice to wholesale clients.