| Searching the Trading Diary Archives |
Use the normal Search function at the top
of the website page:
EXAMPLE |
Trading Diary
July 23, 2003
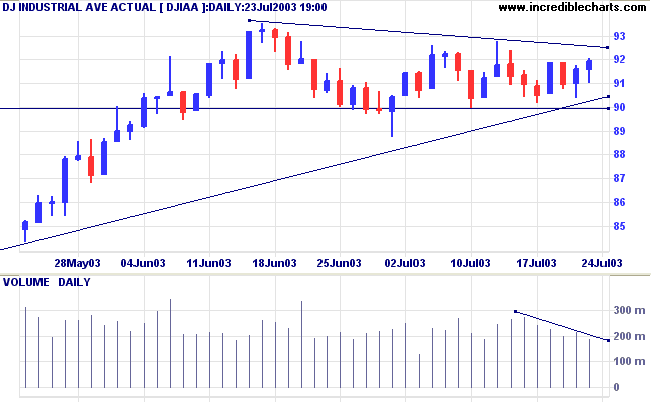
The intermediate trend is up. A fall below 8871 will signal a reversal.
The primary trend is up.
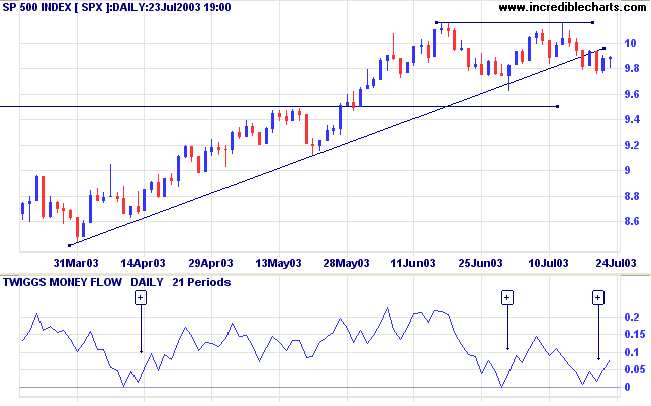
The intermediate trend has turned down. MACD shows a bearish divergence but Twiggs Money Flow (21) completed a bullish trough above zero.
The primary trend is up.
The intermediate trend is up. Price has respected support at 1680, signalling trend strength.
The primary trend is up.
Short-term: Long if the S&P500 is above 994. Short if below 975.
Intermediate: Long if S&P 500 is above 1015. Short if below 962.
Long-term: Long.
AOL reports higher results but investors are uneasy with the media group's accounting problems. (more)
The yield on 10-year notes [TNX] is almost unchanged at 4.11%.
The intermediate trend is up; the primary trend is down.
New York (17.16): Spot gold has rallied strongly to $359.30.
The primary trend is up.
The intermediate trend is up. A fall below support at 2979 would signal a reversal.
The primary trend is up (marginally).
Slow Stochastic (20,3,3) is below its signal line; MACD (26,12,9) is above; Twiggs Money Flow signals accumulation.
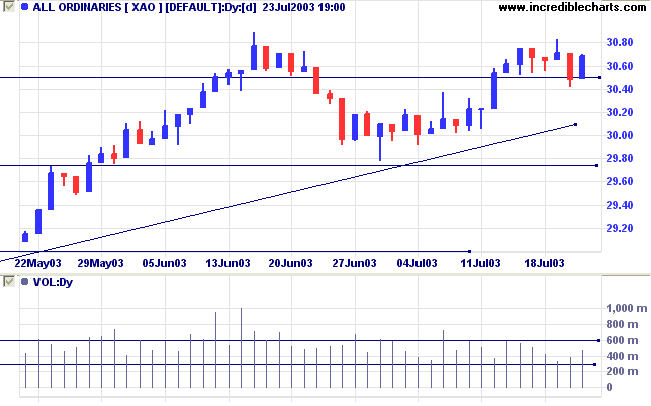
Short-term: Long if the All Ords is above 3071; short if below 3041.
Intermediate: Long if the index is above 3083; short if below 2979.
Long-term: Long if above 2979.
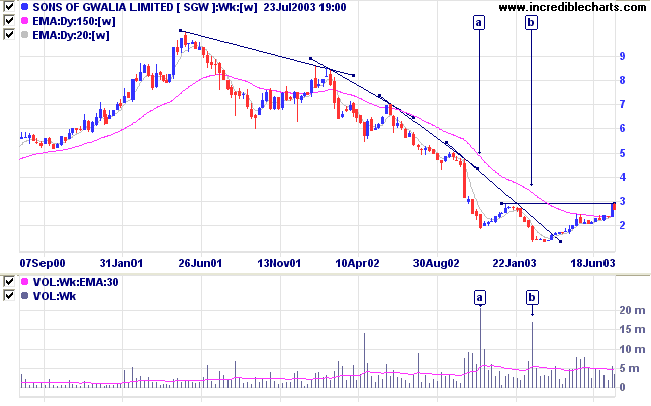
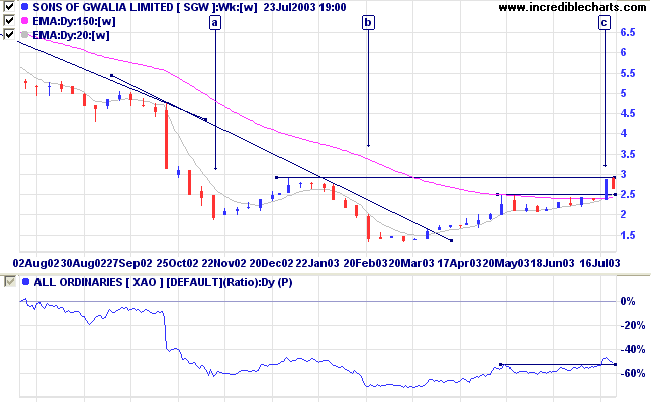
Last covered on October 14, 2002.
SGW ended a lengthy stage 4 down-trend with successive shakeouts (downward spikes) at [a] and [b], accompanied by exceptional volume. Price has since rallied to test resistance at 3.00.
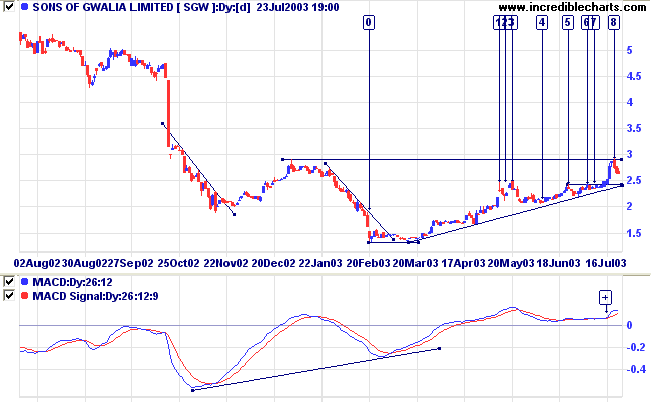
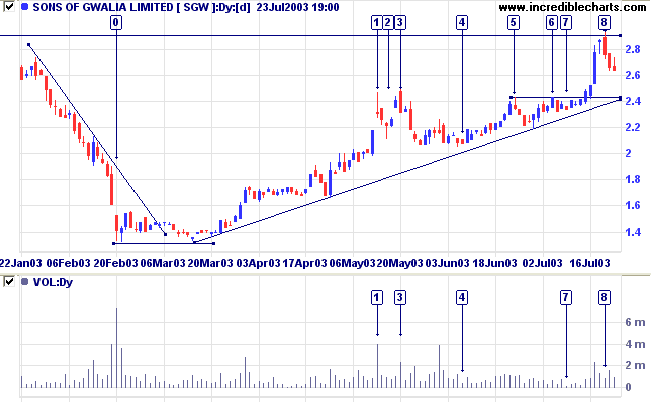
Note three reversal signals in close succession in May: a strong gravestone reversal at [1], after an upward gap and strong volume; a hanging man with low volume at [2]; and finally, a key reversal at [3], again with volume confirmation.
An entry opportunity presented itself at [4] with a dry-up of volume, and volatility, close to the supporting trendline.
The ascending triangle, with equal highs at [5] and [6], is a bullish continuation pattern.
Another short-term entry opportunity presented at [7]. This was followed by a strong rally before a key reversal at [8].
A break below the supporting trendline would be bearish; and a fall below 2.20 will signal a likely test of support at 1.40.
We needed to stop asking about the meaning of life, and instead to think of ourselves
as those who were being questioned by life - daily and hourly.
Our answer must consist, not in talk and meditation, but in right action and in right conduct.
Life ultimately means taking the responsibility to find the right answer to its problems
and to fulfill the tasks which it constantly sets for each individual.
~ Viktor Frankl: Man's Search For Meaning (1963).
|
Scroll Time Period |
|
You can adjust the scroll speed by selecting a larger or smaller scroll period at View>>Scroll Period. |
You can now view back issues at the Daily Trading Diary Archives.
Back Issues

Author: Colin Twiggs is a former investment banker with almost 40 years of experience in financial markets. He co-founded Incredible Charts and writes the popular Trading Diary and Patient Investor newsletters.
Using a top-down approach, Colin identifies key macro trends in the global economy before evaluating selected opportunities using a combination of fundamental and technical analysis.
Focusing on interest rates and financial market liquidity as primary drivers of the economic cycle, he warned of the 2008/2009 and 2020 bear markets well ahead of actual events.
He founded PVT Capital (AFSL No. 546090) in May 2023, which offers investment strategy and advice to wholesale clients.