| Chart Forum: Saving Images |
Complete your post on the Chart Forum, leave a space below the last line and then select the Upload Attachment button:
|
Trading Diary
July 30, 2003
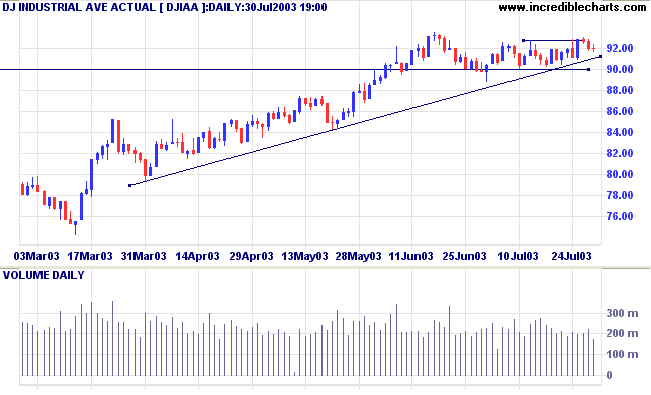
The Dow retreated slightly to close at 9200 on encouragingly low volume.
The intermediate trend is up. A decline below 9000 will signal a down-turn.
The primary trend is up.
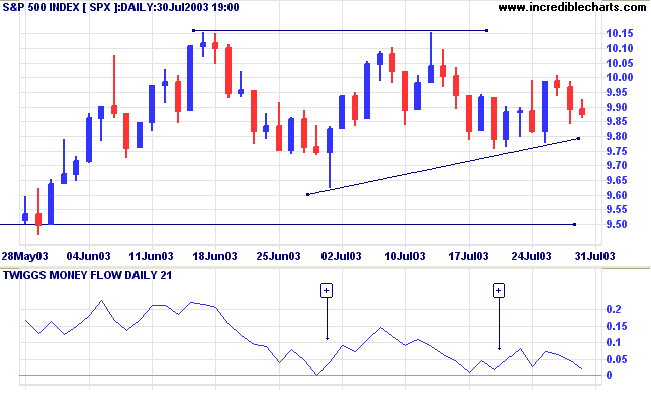
The intermediate trend is up. A fall below 976 will signal a down-turn.
The primary trend is up.
The intermediate trend is up.
The primary trend is up.
Intermediate: Long if the S&P is above 1015. Short if below 962.
Long-term: Long if above 962.
The Fed beige book reports signs of increased manufacturing activity. (more)
CBOE: The yield on 10-year notes retraced to 4.32%.
The intermediate trend is up; the primary trend has reversed upwards.
New York (20.10): Spot gold eased further, to $US 356.20.
On the five-year chart, gold is above the long-term upward trendline.
The intermediate trend is up. The break below support at 3089 shows weakness.
The primary trend is up.
MACD (26,12,9) is above its signal line; Slow Stochastic (20,3,3) has crossed to below; Twiggs Money Flow (21) signals accumulation.
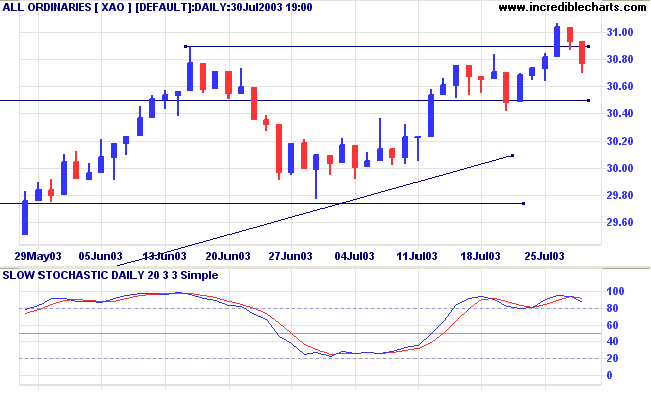
Intermediate: The primary trend is up; Long if the All Ords is above 3093. Short if below 2978.
Long-term: Long if the index is above 2978.
I mentioned on July 7, 2003 that I often combine Volatility Ratio (Schwager) and Volume Spike stock screens to highlight interesting movements in the market. Volatility Ratio uses true range, reflecting both gaps and wide ranging days:
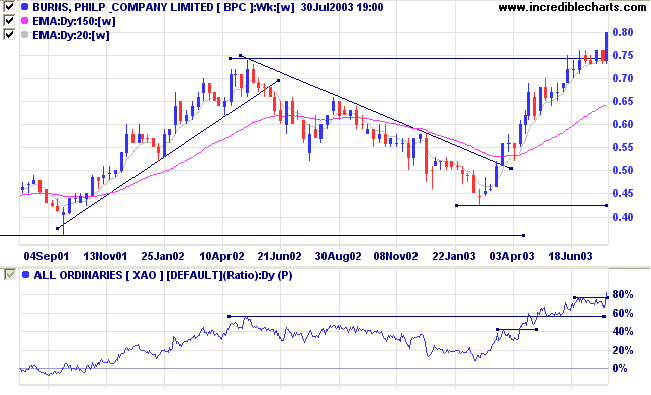
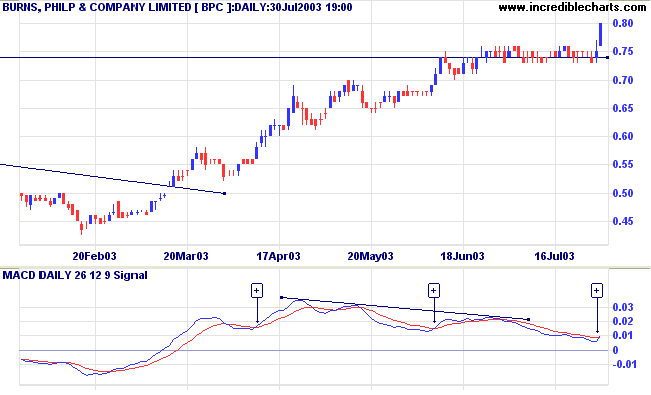
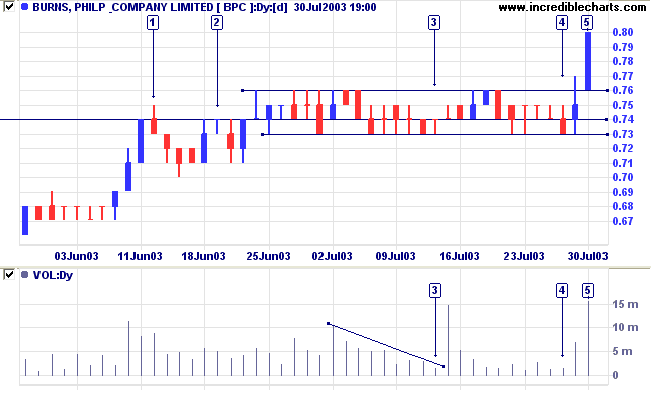
Burns Philp [BPC]
After a strong correction BPC has climbed to a new 1-year high. Relative Strength (price ratio: xao) is strong, while Twiggs Money Flow (100) is rising but still below zero.
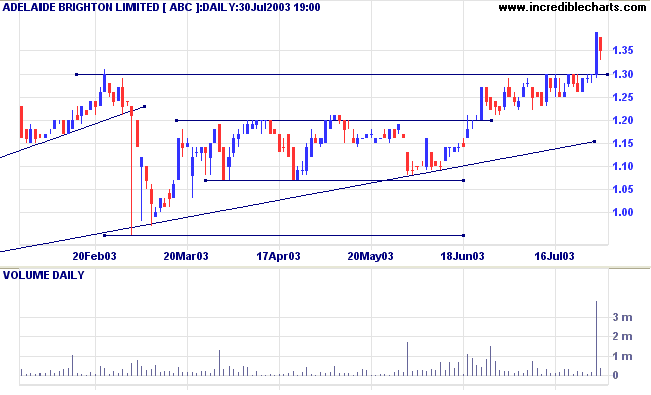
ABC has completed an ascending triangle with a breakout on exceptional volume. It now looks set to pull back to the new support line at 1.30.
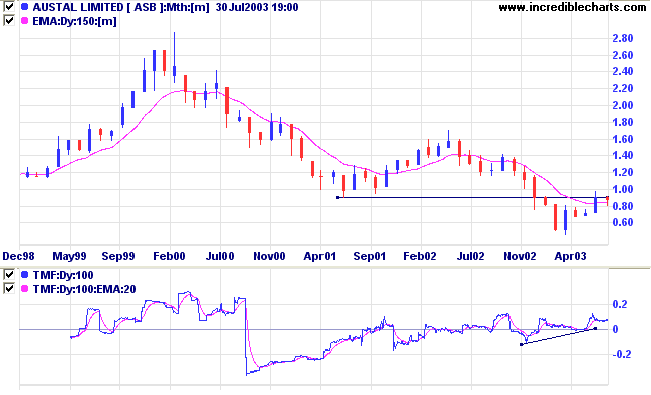
Austal shows a bullish divergence on Twiggs Money Flow (100) but the V-bottom may be unstable. The stock faces strong resistance at 0.90.
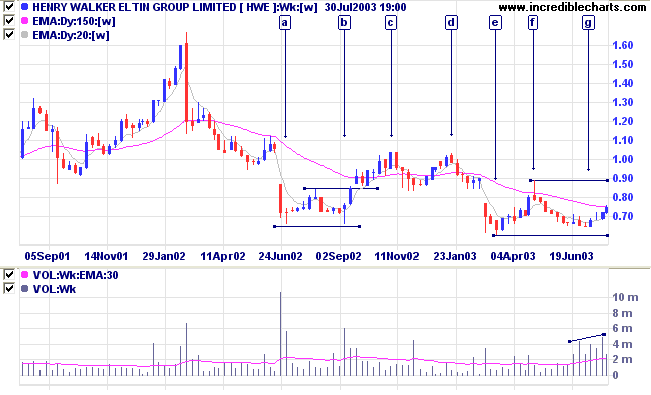
HWE has formed a broad base after the rally to [c] failed with a double top at [d]. We now see a bullish sign at [g], with a higher low on strong volume, after the new low at [e]. A break above 0.90 will complete a double bottom but the target of 1.20 may be affected by strong resistance at 1.05.
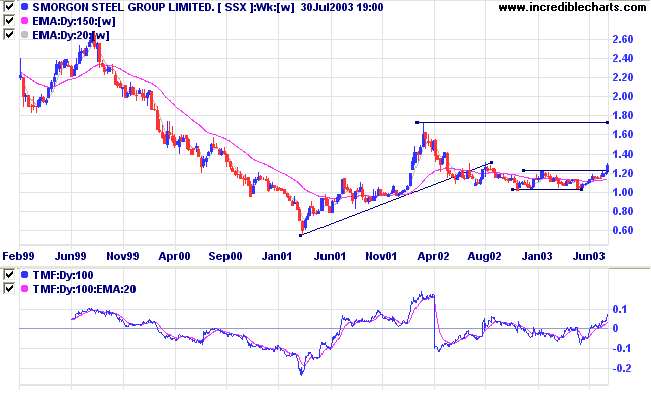
After a lengthy period of consolidation SSX has made a new 6-month high with reasonable volume. Entry opportunities may present themselves on a pull back to the new 1.22 support level.
It is better to "average up" than to "average down."
This opinion is contrary to the one often held and acted upon;
it being the practice to buy and on a decline buy more. This reduces the average.
Probably four times out of five this method will result in striking a reaction in the market that will prevent loss,
but the fifth time, meeting with a permanently declining market, the operator loses his head and closes out,
making a heavy loss - a loss so great as to bring complete demoralization, often ruin.
~ S.A. Nelson: The ABC of Stock Speculation (1903).
| Stock Screens: Trending Stocks |
|
Directional movement
can also be used to identify stocks
that are in a valid up- or down-trend. To select stocks
in an up-trend: |
You can now view back issues at the Daily Trading Diary Archives.
Back Issues

Author: Colin Twiggs is a former investment banker with almost 40 years of experience in financial markets. He co-founded Incredible Charts and writes the popular Trading Diary and Patient Investor newsletters.
Using a top-down approach, Colin identifies key macro trends in the global economy before evaluating selected opportunities using a combination of fundamental and technical analysis.
Focusing on interest rates and financial market liquidity as primary drivers of the economic cycle, he warned of the 2008/2009 and 2020 bear markets well ahead of actual events.
He founded PVT Capital (AFSL No. 546090) in May 2023, which offers investment strategy and advice to wholesale clients.