The existing free resources will continue, with the exception of the Trading Diary.
From May 1st, the daily Trading Diary will be mailed exclusively to Premium members. The weekend edition, with an overview of sectors and markets, will still be available to all members.
Select Time Period >> Chart Complete Data to view 10 years data.
Trading Diary
April 17, 2003
The intermediate trend is down. A rise above 8552 will signal reversal to an up-trend; a fall below 8109 will signal continuation.
Monday 17th's follow through remains valid (as long as the index holds above 7763).
The primary trend is down.
The Nasdaq Composite surprised with a strong rally, rising 2.2% to close at 1425.
The intermediate trend is down. A rise above 1430 will signal a reversal; a fall below 1351 will signal continuation.
The primary trend is up.
The S&P 500 formed an inside day, signaling uncertainty, and closing up 14 points at 893.
The intermediate trend is down; a fall below 862 will signal continuation, a rise above 904 will signal reversal.
The primary trend is down.
The Chartcraft NYSE Bullish % Indicator is at 46% (April 16), after completing a Bull Correction buy signal.
Long-term: There are already two bull signals: the March 17 follow through day and the NYSE Bullish % signal. Wait for confirmation from a Dow/S&P primary trend reversal.
A bearish divergence between the dollar and stock market indices over the past week raises some concerns. (more)
New York (18.00): Spot gold closed at $US 327.00.
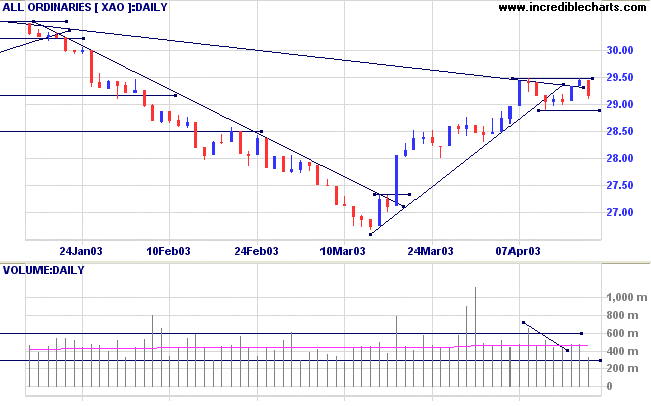
The intermediate up-trend continues. The trendline has been broken; so we should be alert for signs of a reversal.
The primary trend is down.
Slow Stochastic (20,3,3) is above its signal line; MACD (26,12,9) is above its signal line; Twiggs Money Flow (21) signals accumulation.

Long-term: There is already a bull signal: the March 18 follow through day. Wait for confirmation from the primary trend reversal.
Changes are highlighted in bold.
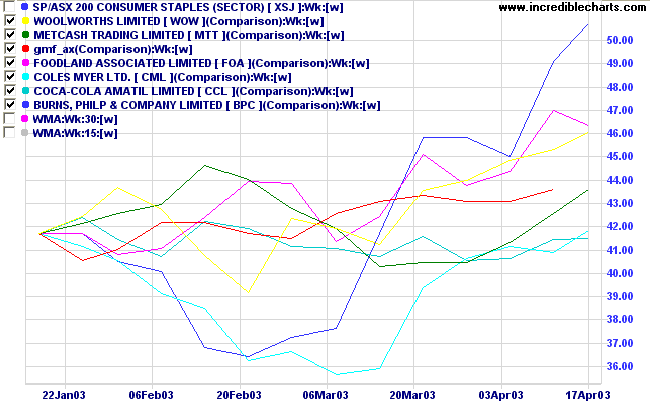
- Energy [XEJ] - stage 4 (RS is level)
- Materials [XMJ] - stage 1 (RS is rising)
- Industrials [XNJ] - stage 4 (RS is falling)
- Consumer Discretionary [XDJ] - stage 1 (RS is level)
- Consumer Staples [XSJ] - stage 2 (RS is rising). This is a v-bottom and may revert to stage 1.
- Health Care [XHJ] - stage 4 (RS is falling)
- Property Trusts [XPJ] - stage 3 (RS is rising)
- Financial excl. Property Trusts [XXJ] - stage 1 (RS is rising)
- Information Technology [XIJ] - stage 4 (RS is falling)
- Telecom Services [XTJ] - stage 4 (RS is falling)
- Utilities [XUJ] - stage 2 (RS is rising)

A stock screen of the ASX 200 using % Price Move (1 month: +5%) returned a more moderate 87 stocks (compared to 131 on April 11, 2003; and 8 on March 14, 2003). The Financial sector is most prominent:
- Banks (5)
- REITs (7)
- Diversified Financial (6)
Always drink upstream from the herd.
- Will Rogers.
Back Issues

Author: Colin Twiggs is a former investment banker with almost 40 years of experience in financial markets. He co-founded Incredible Charts and writes the popular Trading Diary and Patient Investor newsletters.
Using a top-down approach, Colin identifies key macro trends in the global economy before evaluating selected opportunities using a combination of fundamental and technical analysis.
Focusing on interest rates and financial market liquidity as primary drivers of the economic cycle, he warned of the 2008/2009 and 2020 bear markets well ahead of actual events.
He founded PVT Capital (AFSL No. 546090) in May 2023, which offers investment strategy and advice to wholesale clients.
