Active Investing: How important are dividends?
In the short-term stock prices are ruled by market emotion. In the long-term prices tend to converge with sound fundamental values. Warren Buffett v. Dividends introduces investors to the concept of Margin of Safety.
The dividend value calculator demonstrates the importance of dividends and the PEG ratio, in determining fundamental values.
Trading Diary
November 14, 2002
These extracts from my daily trading diary are
intended to illustrate the techniques used in short-term trading
and should not be interpreted as investment advice. Full terms
and conditions can be found at Terms
of Use .
Understanding the Trading Diary provides further guidance.
USA
The Dow gained 1.7% to close at 8542 on lower
volume. The primary trend will reverse (up) if the index rises
above 9130.
The Nasdaq Composite Index opened on a gap to close at 1411, up 3.7%. The primary trend will reverse (up) if the index breaks above 1426.
The S&P 500 gained 22 points to close at 904. The primary trend will complete a double bottom reversal if it rises above 965.
The Chartcraft NYSE Bullish % Indicator signals a bull alert at 40% (November 12).
HSBC in the house
London-based bank HSBC it to expand into the US, buying consumer finance company Household International for $US 14 billion.
Intel breaks 3Gig
Intel boosts the tech market with a new 3.06 Gigahertz chip and announces a 480 million share buyback. (more)
Gold
New York: Spot gold is down 100 cents at $US 317.80.
ASX Australia
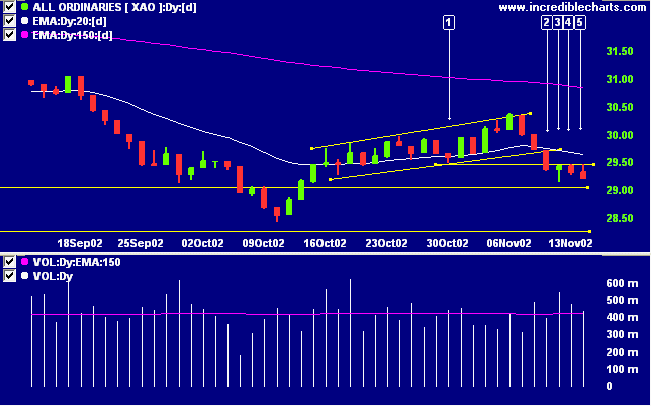
The All Ordinaries lost 21 points to close at 2922 on lower
volume. Sellers are in control.
Day [2] of the correction took out the previous low at [1]. Days [3], [4] and [5] have posted equal highs, respecting the low of day [1], and the index appears set to test the October low.
The primary trend will reverse if the index rises above 3150.
The MACD (26,12,9) and Slow Stochastic (20,3,3) are below their signal lines, while Twiggs money flow signals distribution.
News Corporation [NCP]
Last covered on November 12:
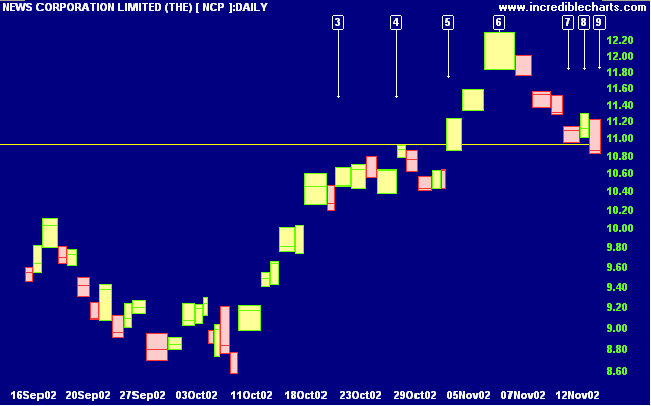
A rise above the high of day [7] will be a bullish entry signal; closing of the gap to 11.27, even stronger.
A break below support at 10.92 would be a bearish signal; a break below the low of 10.37 at [4] would be even stronger.
NCP has managed to produce both bull and bear signals within the space of two days: day [8] closed the previous gap and [9] reversed below support, activating the stop below 10.92. As an 8-year old, my soccer coach taught us the drill: "When in doubt - kick it out!" The same applies to trading: if your trade is not going according to plan - get out.
As Edwin Lefevre's says: "there is no profit in being wrong at any time".
Back Issues
Last covered on November 12:
A rise above the high of day [7] will be a bullish entry signal; closing of the gap to 11.27, even stronger.
A break below support at 10.92 would be a bearish signal; a break below the low of 10.37 at [4] would be even stronger.
NCP has managed to produce both bull and bear signals within the space of two days: day [8] closed the previous gap and [9] reversed below support, activating the stop below 10.92. As an 8-year old, my soccer coach taught us the drill: "When in doubt - kick it out!" The same applies to trading: if your trade is not going according to plan - get out.
As Edwin Lefevre's says: "there is no profit in being wrong at any time".
Relative strength (price ratio: xao), MACD and Twiggs money
flow are all bullish.
A rally above the high of [8] will be a bull signal. A fall below the low of [9] would be a bear signal.
A rally above the high of [8] will be a bull signal. A fall below the low of [9] would be a bear signal.
QBE Insurance Group [QBE]
Last covered on October 30:
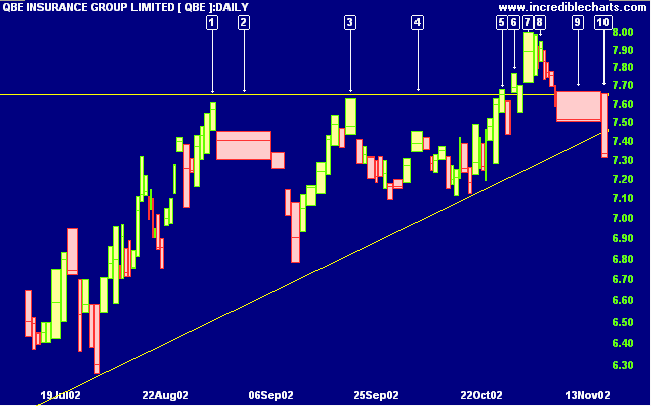
The safest entry point will be if a pull-back is of short duration and respects the 7.65 support line.
The pull-back after [6] broke the 7.65 support line but was still a valid entry point, rallying the next day to 8.00. The long shadow at [7] and two successive inside days forewarn of the weak rally at [8]. The pull-back is on weak volume until buying support enters at [9]. The pattern is now shaping as a bull trap with sellers having overcome support at [10].
Last covered on October 30:
The safest entry point will be if a pull-back is of short duration and respects the 7.65 support line.
The pull-back after [6] broke the 7.65 support line but was still a valid entry point, rallying the next day to 8.00. The long shadow at [7] and two successive inside days forewarn of the weak rally at [8]. The pull-back is on weak volume until buying support enters at [9]. The pattern is now shaping as a bull trap with sellers having overcome support at [10].
Relative strength (price ratio:xao) is still positive but
MACD and Twiggs money flow signal bearish divergences. Twiggs
money flow has fallen sharply below zero, signaling
distribution.
Further downward movement, below the low of [10], will be a strong bear signal, while a rise above 7.65 would be bullish.
Further downward movement, below the low of [10], will be a strong bear signal, while a rise above 7.65 would be bullish.
Short-term: Short if there is a break below the low of 2920:
The Slow Stochastic and MACD are below their respective
signal lines.
Medium-term: Avoid new entries. Use stop losses to protect
yourself against a sudden reversal.
Long-term: Wait for confirmation of the
bottom reversal signal.
Colin Twiggs
Don't trade the market,
trade what you know.
- Bill McLaren
In other words, don't trade every pattern in the market
- trade the ones that you know and trust.
trade what you know.
- Bill McLaren
In other words, don't trade every pattern in the market
- trade the ones that you know and trust.
Back Issues
Click here to access the
Trading Diary Archives.
Back Issues
Access the Trading Diary Archives.

Author: Colin Twiggs is a former investment banker with almost 40 years of experience in financial markets. He co-founded Incredible Charts and writes the popular Trading Diary and Patient Investor newsletters.
Using a top-down approach, Colin identifies key macro trends in the global economy before evaluating selected opportunities using a combination of fundamental and technical analysis.
Focusing on interest rates and financial market liquidity as primary drivers of the economic cycle, he warned of the 2008/2009 and 2020 bear markets well ahead of actual events.
He founded PVT Capital (AFSL No. 546090) in May 2023, which offers investment strategy and advice to wholesale clients.