Understanding the Trading Diary
Trading Diary
November 12, 2002
These extracts from my daily trading diary are
intended to illustrate the techniques used in short-term trading
and should not be interpreted as investment advice. Full terms
and conditions can be found at Terms
of Use .
USA
The Dow formed an inside day, rallying to 8500 before
encountering selling pressure at the close. The average was up
slightly at 8386 but the weak close and higher volume signal that
sellers are in control. The primary trend will reverse if the
index rises above 9130.
The Nasdaq Composite Index fared better, gaining 2.3% to close at 1349. The primary trend will reverse (up) if the index breaks above 1426.
The S&P 500 had a similar day to the Dow, closing up 6 points at 882. The primary trend will complete a double bottom reversal if it rises above 965.
The Chartcraft NYSE Bullish % Indicator signals a bull alert at 40% (November 11).
Philip Morris
The tobacco company warns that it is unlikely to meet next year's earnings forecasts. (more)
Gold
New York: Spot gold is up 280 cents at $US 323.90.
The tobacco company warns that it is unlikely to meet next year's earnings forecasts. (more)
Gold
New York: Spot gold is up 280 cents at $US 323.90.
ASX Australia
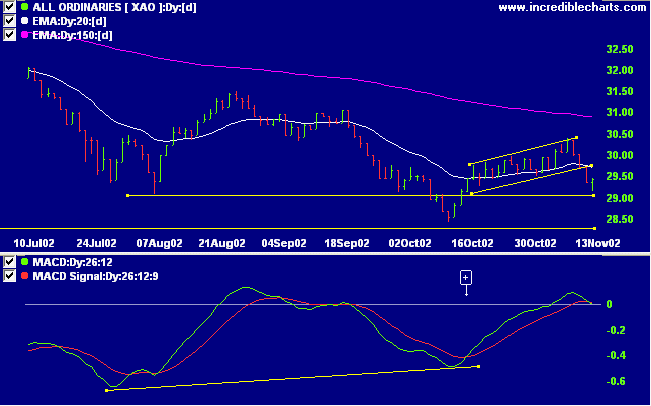
The All Ordinaries index held above support at 2909, rallying
in the afternoon to close at 2943 on strong volume. Buyers are
in control. The primary trend will reverse if the index rises
above 3150.
The MACD (26,12,9) has crossed below its signal line, Slow Stochastic (20,3,3) is already below its signal line, while Twiggs money flow is rising.
The MACD (26,12,9) has crossed below its signal line, Slow Stochastic (20,3,3) is already below its signal line, while Twiggs money flow is rising.
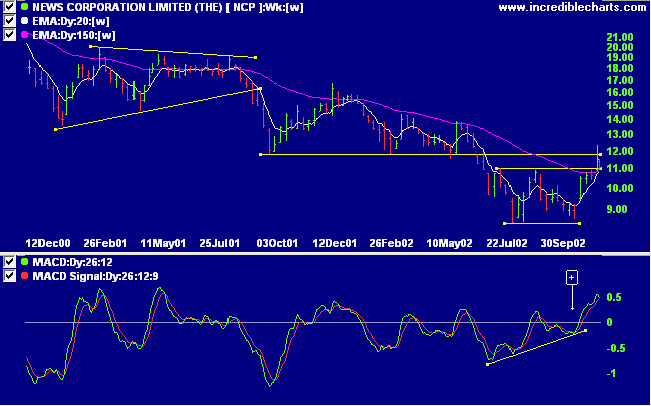
News Corporation [NCP]
Last covered on October 28.
NCP completed a double bottom reversal accompanied by a bullish divergence on MACD [+]. The breakout has been followed by a pull-back to the support line. Relative strength (price ratio: xao) is rising and Twiggs money flow signals accumulation.
Back Issues
Last covered on October 28.
NCP completed a double bottom reversal accompanied by a bullish divergence on MACD [+]. The breakout has been followed by a pull-back to the support line. Relative strength (price ratio: xao) is rising and Twiggs money flow signals accumulation.
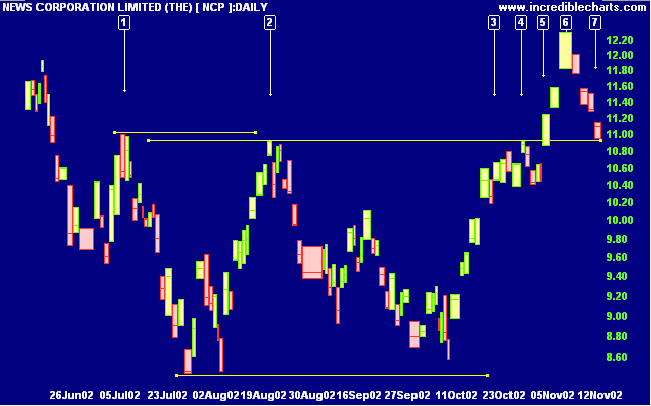
After equal highs at [1], [2] and [4], NCP broke above
resistance at [5] on good volume. The rally culminated at [6]
after the third successive upwards gap and increased volume.
The pull-back over the next 4 days has been on weaker volume
and the long shadow at [7] indicates increased buying
support.
A rise above the high of day [7] will be a bullish entry
signal; closing of the gap to 11.27, even stronger.
A break below support at 10.92 would be a bearish signal; a break below the low of 10.37 at [4] would be even stronger.
A break below support at 10.92 would be a bearish signal; a break below the low of 10.37 at [4] would be even stronger.
Short-term: Avoid new trades unless there is a break below
support at 2909: The Slow Stochastic and MACD are below their
respective signal lines but buyers were in control at the
close.
Medium-term: Avoid new entries. Use stop losses to protect
yourself against a sudden reversal.
Long-term: Wait for confirmation of the
bottom reversal signal.
Colin Twiggs
Plan your work
and work your plan.
- Stephen Covey
and work your plan.
- Stephen Covey
Back Issues
Click here to access the
Trading Diary Archives.
Back Issues
Access the Trading Diary Archives.

Author: Colin Twiggs is a former investment banker with almost 40 years of experience in financial markets. He co-founded Incredible Charts and writes the popular Trading Diary and Patient Investor newsletters.
Using a top-down approach, Colin identifies key macro trends in the global economy before evaluating selected opportunities using a combination of fundamental and technical analysis.
Focusing on interest rates and financial market liquidity as primary drivers of the economic cycle, he warned of the 2008/2009 and 2020 bear markets well ahead of actual events.
He founded PVT Capital (AFSL No. 546090) in May 2023, which offers investment strategy and advice to wholesale clients.