S&P 500 meets resistance
By Colin Twiggs
February 24th, 2014 6:30 pm ET (10:30 am AEDT)
These extracts from my trading diary are for educational purposes. Any advice contained therein is provided for the general information of readers and does not have regard to any particular person's investment objectives, financial situation or needs and must not be construed as advice to buy, sell, hold or otherwise deal with any securities or other investments. Accordingly, no reader should act on the basis of any information contained therein without first having consulted a suitably qualified financial advisor. Full terms and conditions can be found at Terms of Use.
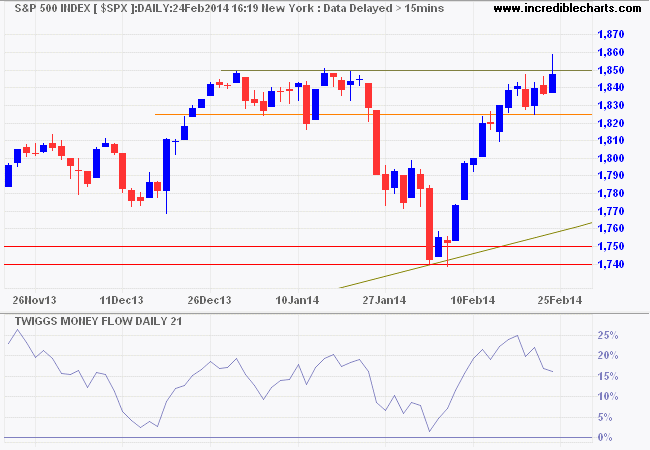
The S&P 500 encountered stout resistance at 1850, highlighted by today's false breakout. Follow-through above 1860 would indicate that buyers out-number sellers, signaling an advance to 1950*. Reversal below 1825 is unlikely, but would warn of another correction. The long-term trend remains bullish, with repeated 21-day Twiggs Money Flow troughs above the zero line.

* Target calculation: 1850 + ( 1850 - 1750 ) = 1950
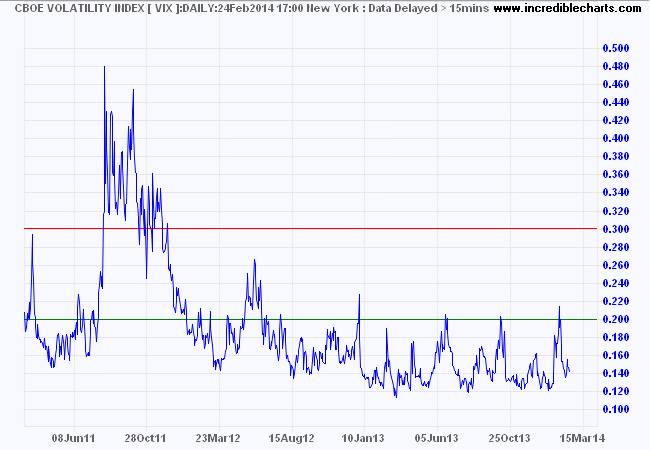
CBOE Volatility Index (VIX) below 20 reflects low risk typical of a bull market.

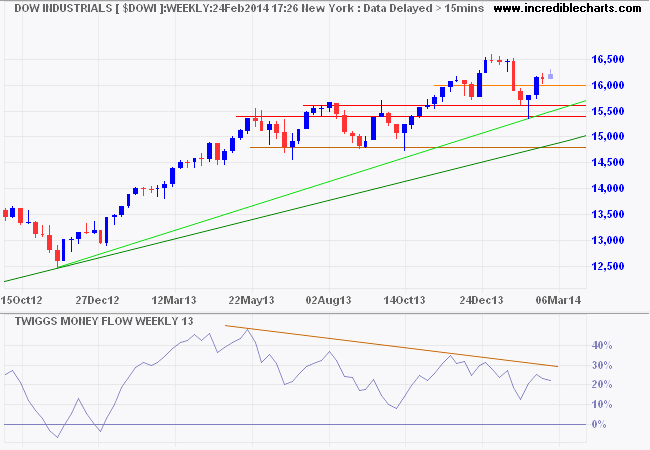
Dow Jones Industrial Average is weaker. Large bearish divergence on 13-week Twiggs Money Flow warns of selling pressure. Reversal below 16000 would warn of a correction to test primary support at 15400.

* Target calculation: 16500 + ( 16500 - 15500 ) = 17500
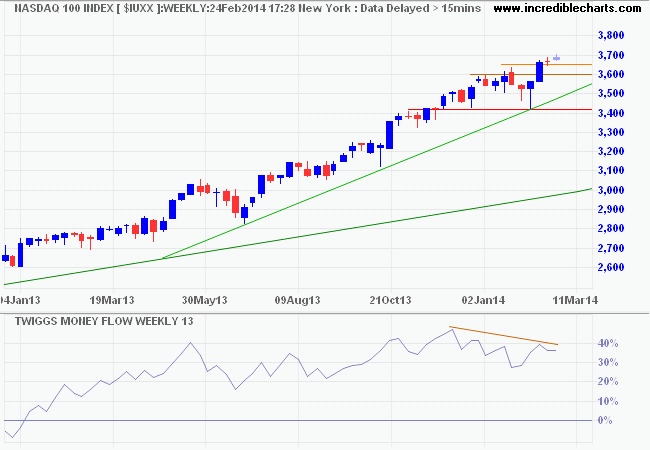
The Nasdaq 100, on the other hand, remains bullish. Reversal below 3600, especially after last week's doji star candlestick formation, would warn of a test of primary support at 3400. Decline of 13-week Twiggs Money Flow below its recent low would strengthen the signal. Breakout above 3700, however, would offer a target of 3800*.

* Target calculation: 3600 + ( 3600 - 3400 ) = 3800
What's New: Youtube, Videos and Facebook
If you look for perfection, you'll never be content.
~ Leo Tolstoy

Author: Colin Twiggs is a former investment banker with almost 40 years of experience in financial markets. He co-founded Incredible Charts and writes the popular Trading Diary and Patient Investor newsletters.
Using a top-down approach, Colin identifies key macro trends in the global economy before evaluating selected opportunities using a combination of fundamental and technical analysis.
Focusing on interest rates and financial market liquidity as primary drivers of the economic cycle, he warned of the 2008/2009 and 2020 bear markets well ahead of actual events.
He founded PVT Capital (AFSL No. 546090) in May 2023, which offers investment strategy and advice to wholesale clients.
