What's New: Incredible Charts 5.0.0.86
By Colin Twiggs
December 3, 2009 5:00 a.m. ET (9:00 p.m. AET)
This newsletter is subject to Incredible Charts Terms of Use.
New Release Version: Incredible Charts 5.0.0.86
The last beta version will now be released as a full (stable) version for use by all subscribers. The version offers a number of new indicators — detailed in our last update.
New Indicator
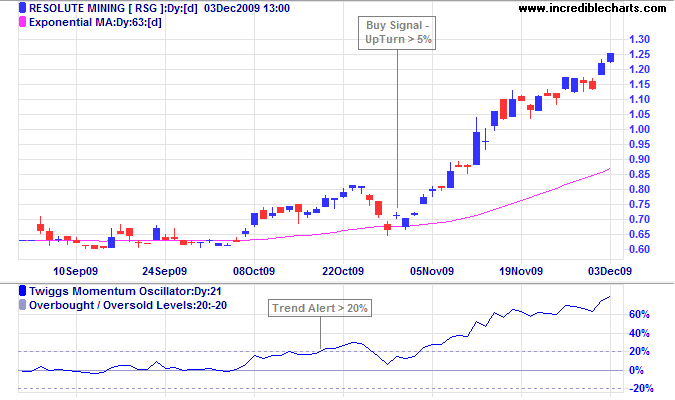
I have developed a new momentum oscillator which we named the Twiggs Momentum Oscillator. Smoother than the Rate Of Change oscillator, its primary purpose is to identify fast trending stocks using the stock screener. It can, however, be successfully used to generate buy and sell signals in a similar fashion to other momentum oscillators. This is now available in the Indicator Panel and will be added shortly as a stock screen filter.

Free Subscribers
Free subscribers will notice that some new indicators are colored gray in the Indicator panel. These will only be available to premium subscribers after the free trial period expires: at the end of January 2010.
Minor Adjustments
We have made some minor adjustments to improve ease of use and accessibility of some indicators.
Volume Moving Average
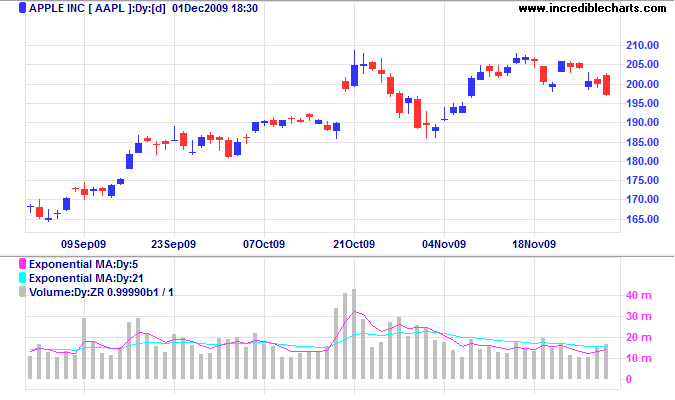
Volume Moving Average is now listed as a separate indicator on the Indicator Panel. You can add up to three moving averages: the crossovers are useful in signaling rising or falling volume.

Linear Regression
We fixed a bug that prevented Weekly and Monthly Linear regression from displaying correctly.
ATR Bands & Percentage Bands
ATR Bands and Percentage Bands were also not displaying correctly. This has been fixed.
Median Price & Typical Price Moving Averages
You can now plot up to three moving averages on Typical or Median Price. Typical price is calculated as (High + Low + Close) / 3, whereas Median Price is (High + Low ) / 2.
New ASX 300 Sector/Industry Group Indexes
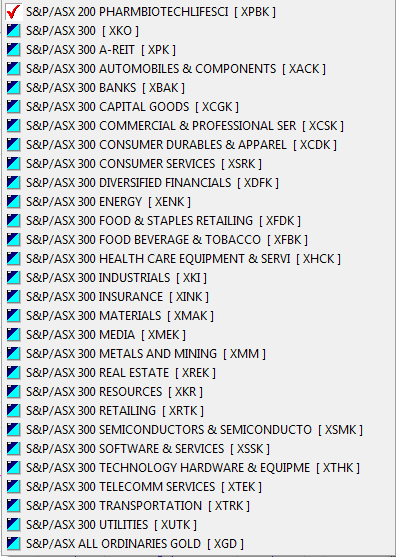
We now offer Industry Group indexes in addition to Sector Indexes for the ASX. These are included in a new Watchlist [ASX 300 Industry Groups] available from the Watchlist menu.

Development Plans
We continue to expand our development team and hope to report more frequent improvements to the charts, stock screener and data coverage in future. Thank you for all the suggestions and requests. While not all can be accommodated, the weight of requests guides us in setting future development priorities.
In terms of the priorities announced mid-year, we have delivered new Indicators, a new Trading Competition format, and, shortly, will deliver new Stock Screen Filters. We are making good progress in a number of other areas, but most will have to be carried over into the first quarter of the new year:
| Development Priority | Estimated Completion* |
| Stock Screens - New Filters** | 1 week |
| Stock Screens - Additional Filters | 8 weeks |
| Stock Screens - New Watchlists*** | 8 weeks |
| Stock Screens - Daily/Weekly Email Updates | 12 weeks |
| Quicker Chart Updates | 6 weeks |
| Delayed Data (15/20 Minute) | 12 weeks |
| Hour & Minute Bars | 12 - 18 weeks |
* Estimated Completion is a rough guide only.
** New Stock Screen Filters include Twiggs Money Flow, Twiggs Momentum Oscillator, Linear Regression, New Highs & New Lows filters, Slow Stochastic Overbought/Oversold, and Value (Volume x Closing Price) filter.
*** Includes new watchlist import and export functions, editing tools and additional display fields such as sectors, industries, index components and latest prices.
The dictionary is the only place where success comes before work. Hard work is the price we must pay for success. I think you can accomplish anything if you're willing to pay the price.
~ Vince Lombardi.

Author: Colin Twiggs is a former investment banker with almost 40 years of experience in financial markets. He co-founded Incredible Charts and writes the popular Trading Diary and Patient Investor newsletters.
Using a top-down approach, Colin identifies key macro trends in the global economy before evaluating selected opportunities using a combination of fundamental and technical analysis.
Focusing on interest rates and financial market liquidity as primary drivers of the economic cycle, he warned of the 2008/2009 and 2020 bear markets well ahead of actual events.
He founded PVT Capital (AFSL No. 546090) in May 2023, which offers investment strategy and advice to wholesale clients.
